
The State of REITs: June 2022 Edition
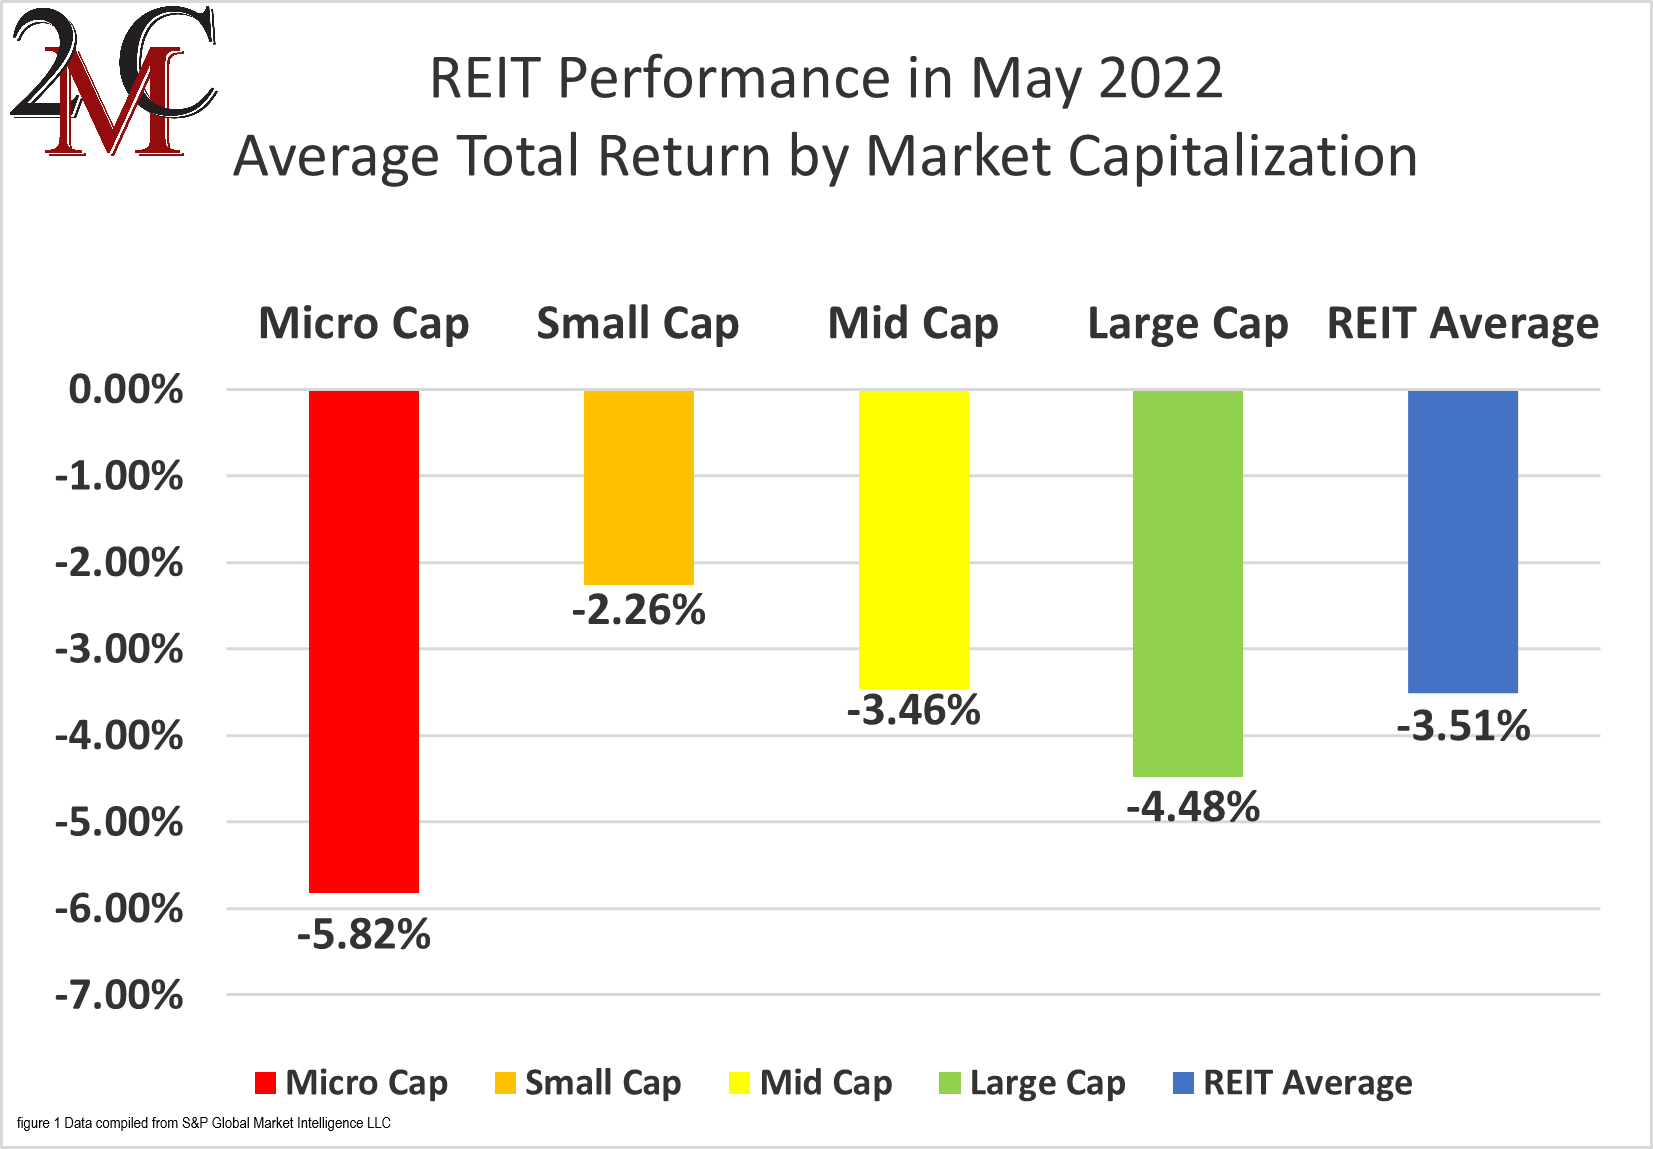
- The REIT sector has fallen in 4 of the first 5 months of 2022, including a -3.51% total return in May.
- Small-cap (-2.26%) and mid-cap (-3.46%) REITs outperformed, while large caps (-4.48%) and micro caps (-5.82%) saw deeper losses in May.
- Only 31.18% of REIT securities had a positive total return in May.
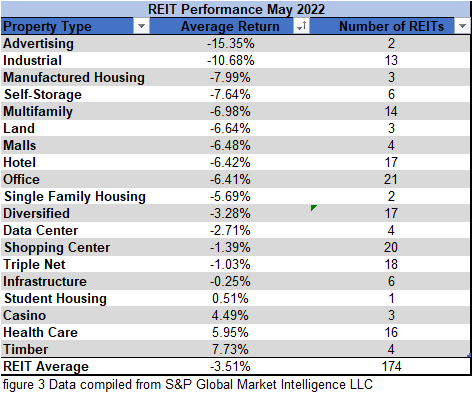
- Timber (+7.73%) and Health Care (+5.95%) led all property types in May. Advertising (-15.35%) and Industrial (-10.68%) REITs underperformed.
- The average REIT NAV discount widened from -11.94% to -15.59% during May. The median NAV discount also widened from -9.55% to -14.82%.
REIT Performance
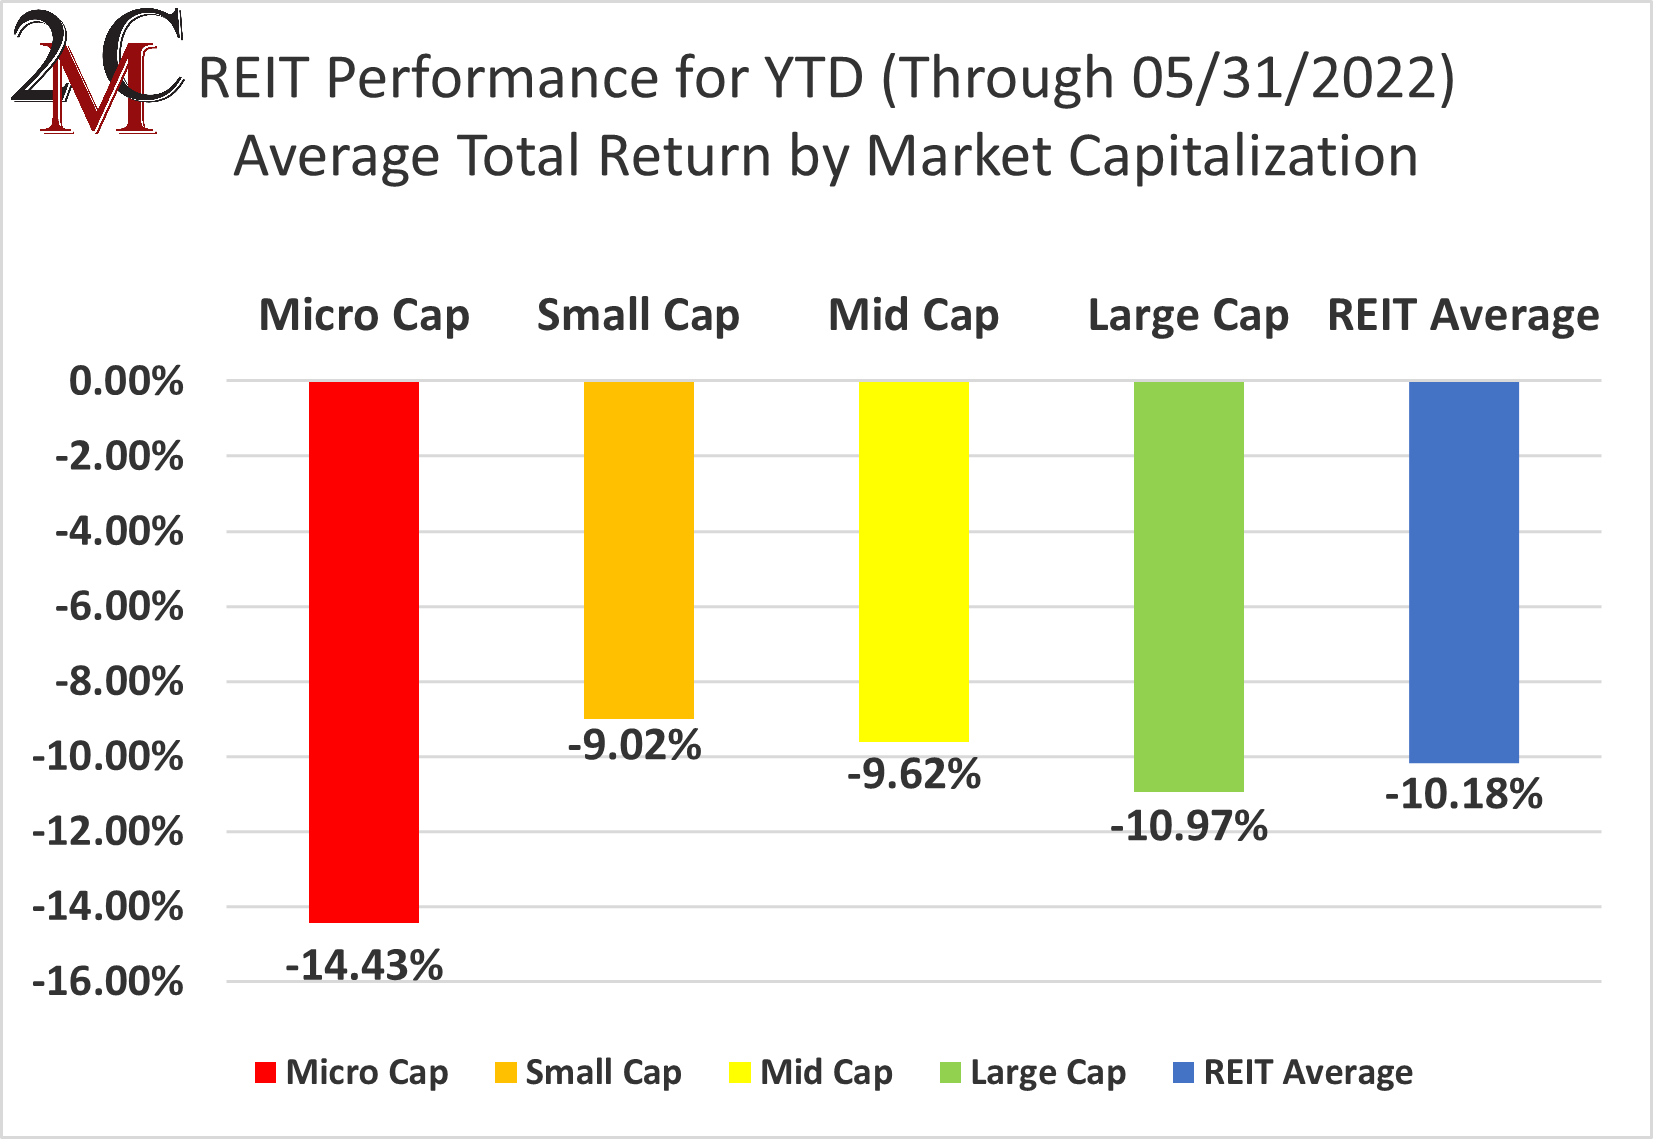
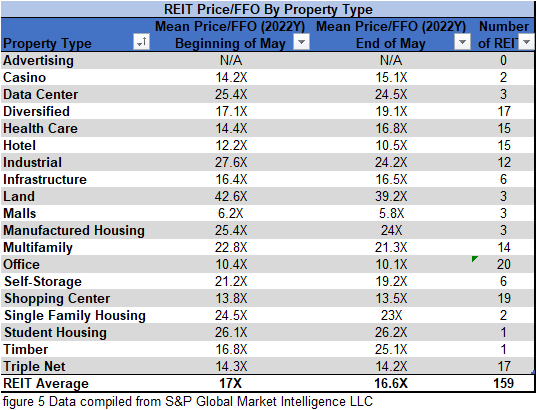
The REIT sector’s 2022 performance sunk deeper into the red with a -3.51% total return in May. REITs underperformed the Dow Jones Industrial Average (+0.33%), the S&P 500 (+0.18%), and the NASDAQ (-1.9%) in May. The market-cap-weighted Vanguard Real Estate ETF (VNQ) suffered greater losses than the average REIT in May (-4.69% vs. -3.51%) as well as YTD (-14.13% vs. -10.18%). The spread between the 2022 FFO multiples of large-cap REITs (20.9x) and small-cap REITs (15.8x) narrowed in May as multiples decreased by 1.3 turns for large caps and increased by 0.1 turn for small caps. In this monthly publication, I will provide REIT data on numerous metrics to help readers identify which property types and individual securities currently offer the best opportunities to achieve their investment goals.
4 out of 19 Property Types Yielded Positive Total Returns in May
Only 31% of REIT property types averaged a positive total return in May, with a 23.08% total return spread between the best and worst performing property types. Advertising (-15.35%) and Industrial (-10.68%) REITs had the worst average total returns in May. Both Advertising REITS, OUTFRONT Media (OUT) and Lamar Advertising Company (LAMR), declined by double digits as investors have grown more bearish on advertising sales as the economy has weakened. This negative sentiment was magnified when Snap Inc. (SNAP) released earnings on May 23rd with a grim outlook on digital ad sales. Although OUT and LAMR are focused more heavily on physical billboards and are fundamentally less impacted by a slowdown in digital ad sales, they appear to have gotten caught up in a broad advertising selloff.
Timber (+7.73%) and Health Care (+5.95%) REITs led all property types in May. Although 3 of the 4 Timber REITs saw single-digit declines, CatchMark Timber Trust (CTT) pulled the whole Timber sector up when it soared upon the announcement that it would be acquired by PotlatchDeltic (PCH).

Performance of Individual Securities
CatchMark Timber Trust (CTT) (+44.90%) announced pre-market on May 31st that it would be acquired by PotlatchDeltic at a substantial premium to the prior trading day’s closing share price. CTT shareholders will receive 0.23 shares of PCH for every CTT share they hold. The transaction is expected to close in the 2nd half of 2022. CTT is now the 2nd best performing REIT thus far in 2022 with a +37.89% total return. Only Preferred Apartment Communities (APTS) has achieved larger gains (+39.06%).
New York City REIT (NYC) (-39.01%) posted earnings on May 13th that showed FFO/share improved year over year in Q1 2022 but remains in negative territory. The New York City focused office REIT is also embroiled in a battle with activists seeking a change to the board due to the REIT’s continued poor operational performance.
Only 31.18% of REITs had a positive return in May with only 24.00% in the black year to date. During the first five months of last year, the average REIT had a +22.23% return, whereas this year the average REIT has seen a -10.18% decline.

Dividend Yield
Dividend yield is an important component of a REIT’s total return. The particularly high dividend yields of the REIT sector are, for many investors, the primary reason for investment in this sector. As many REITs are currently trading at share prices well below their NAV, yields are currently quite high for many REITs within the sector. Although a particularly high yield for a REIT may sometimes reflect a disproportionately high risk, there exist opportunities in some cases to capitalize on dividend yields that are sufficiently attractive to justify the underlying risks of the investment. I have included below a table ranking equity REITs from highest dividend yield (as of 05/31/2022) to lowest dividend yield.

Although a REIT’s decision regarding whether to pay a quarterly dividend or a monthly dividend does not reflect on the quality of the company’s fundamentals or operations, a monthly dividend allows for a smoother cash flow to the investor. Below is a list of equity REITs that pay monthly dividends ranked from highest yield to lowest yield.

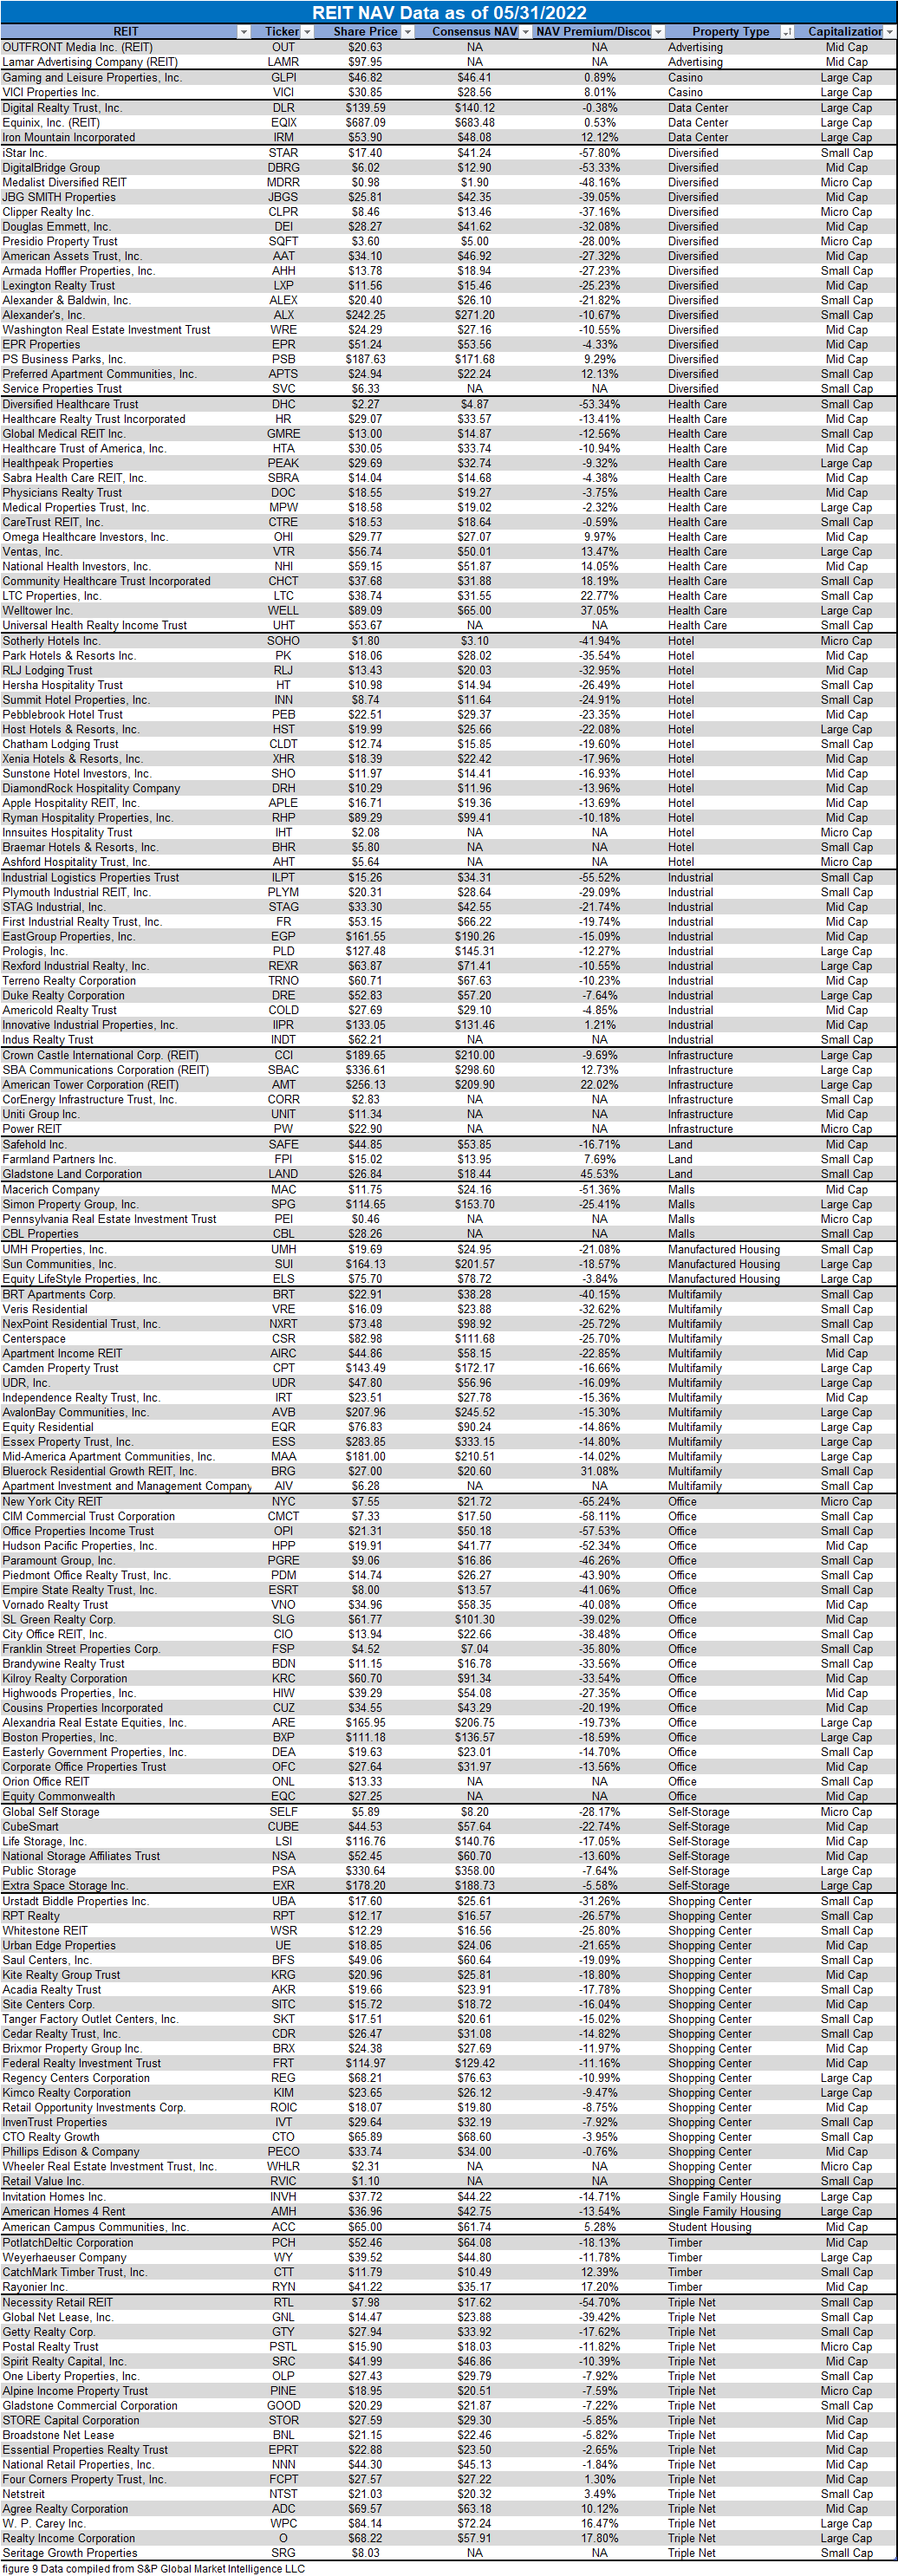
REIT Premium/Discount to NAV by Property Type
Below is a downloadable data table, which ranks REITs within each property type from the largest discount to the largest premium to NAV. The consensus NAV used for this table is the average of analyst NAV estimates for each REIT. Both the NAV and the share price will change over time, so I will continue to include this table in upcoming issues of The State of REITs with updated consensus NAV estimates for each REIT for which such an estimate is available.
Takeaway
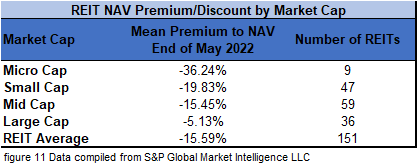
The large-cap REIT premium (relative to small-cap REITs) narrowed in May and investors are now paying on average about 32% more for each dollar of 2022 FFO/share to buy large-cap REITs than small-cap REITs (20.9x/15.8x – 1 = 32.3%). As can be seen in the table below, there is presently a strong positive correlation between market cap and FFO multiple.

The table below shows the average premium/discount of REITs of each market cap bucket. This data, much like the data for price/FFO, shows a strong, positive correlation between market cap and Price/NAV. The average large-cap REIT (-5.13%) trades at a single-digit discount to NAV, while mid-cap REITs (-15.45%) and small-cap REITs (-19.83%) trade at double-digit discounts. Microcaps on average trade at less than 2/3 of their respective NAVs (-36.24%).
These first 5 months of 2022 have seen an increasing number of high-profile companies announcing poor earnings and disappointing guidance. In some cases, layoffs or substantial hiring reductions have been implemented as well due to poor company fundamentals. The vast majority of publicly-traded stocks have seen significant price declines over this period, including the REIT sector. However, REITs have largely performed very well fundamentally. The REIT sector achieved same-store net operating income (SS-NOI) growth of 8.6% in Q1 2022, an improvement over the already strong 8.0% SS-NOI growth in Q4 2021.


Median SS-NOI growth was positive across the board but did vary by property type. Self Storage REITs and Malls saw the strongest median growth at 22.1% and 18% respectively. For Malls, this represented continued recovery from the NOI collapse caused by government-imposed lockdowns during the height of the pandemic, whereas for Self Storage this represented continued stellar growth after numerous years of strong fundamental performance. Office and Health Care REITs saw the weakest median SS-NOI growth at only 3.9% and 2.8% respectively.
Although the strongest SS-NOI growth in Q1 2022 belongs to Mall REIT Macerich (MAC) with a remarkable 30.2% year-over-year increase, all 6 Self Storage REITs are among the top 8 for highest SS-NOI growth. None of the equity REITs experienced a double-digit SS-NOI decline and even a -0.1% decline was enough to fall in the bottom 10 REITs for growth. Office REITs accounted for 3 of the 10 REITs with negative SS-NOI growth in Q1, with Franklin Street Properties (FSP) and City Office REIT (CIO) suffering the largest declines of -6.1% and -4.7% respectively.

There is certainly potential for REIT share prices to experience continued volatility as the Federal Reserve proceeds with its plan to aggressively hike interest rates and the US economy continues to struggle with very high inflation. However, thus far REIT fundamentals remain very strong and inflation is likely to fuel continued robust rent roll-ups that will in turn drive further SS-NOI growth. The economic picture may be growing darker, but REIT fundamentals remain a bright spot.
Important Notes and Disclosure
All articles are published and provided as an information source for investors capable of making their own investment decisions. None of the information offered should be construed to be advice or a recommendation that any particular security, portfolio of securities, transaction, or investment strategy is suitable for any specific person. The information offered is impersonal and not tailored to the investment needs of any specific person.
We cannot determine whether the content of any article or recommendation is appropriate for any specific person. Readers should contact their financial professional to discuss the suitability of any of the strategies or holdings before implementation in their portfolio. Research and information are provided for informational purposes only and are not intended for trading purposes. NEVER make an investment decision based solely on the information provided in our articles.
We may hold, purchase, or sell positions in securities mentioned in our articles and will not disclose this information to subscribers, nor the time the positions in the securities were acquired. We may liquidate shares in profiled companies at any time without notice. We may also take positions inconsistent with the information and views expressed on our website.
We routinely own and trade the same securities purchased or sold for advisory clients of 2MCAC. This circumstance is communicated to our clients on an ongoing basis. As fiduciaries, we prioritize our clients’ interests above those of our corporate and personal accounts to avoid conflict and adverse selection in trading these commonly held interests.
Past performance does not guarantee future results. Investing in publicly held securities is speculative and involves risk, including the possible loss of principal. Historical returns should not be used as the primary basis for investment decisions. Although the statements of fact and data in this report have been obtained from sources believed to be reliable, 2MCAC does not guarantee their accuracy and assumes no liability or responsibility for any omissions/errors
Commentary may contain forward-looking statements that are by definition uncertain. Actual results may differ materially from our forecasts or estimations, and 2MCAC and its affiliates cannot be held liable for the use of and reliance upon the opinions, estimates, forecasts, and findings in this article.
Through October 2021, The State of REITs was published exclusively on Seeking Alpha by Simon Bowler, Sector Analyst at 2nd Market Capital Services Corporation (2MCSC). Editions subsequent to October 2021 will be published on this website in addition to other platforms that may include Seeking Alpha. 2MCSC was formed in 1989 and provides investment research and consulting services to the financial services industry and the financial media. 2MCSC does not provide investment advice. 2MCSC is a separate entity but related under common ownership to 2nd Market Capital Advisory (2MCAC), a Wisconsin registered investment advisor. Simon Bowler is an investment advisor representative of 2MCAC. Any positive comments made by others should not be construed as an endorsement of the author's abilities to act as an investment advisor.
S&P disclosure: S&P Global Market Intelligence LLC. Contains copyrighted material distributed under license from S&P.