
The State of REITs: October 2020 Edition
- The REIT sector has now endured losses in 6 of the first 9 months of 2020, with a -4.82% total return
- Micro cap REITs were the hardest hit in September with an average loss of -9.97%, while large caps saw more modest losses with an average return of -2.41%
- Only 18.89% of REIT securities had a positive total return in September
- Casino and Student Housing REITs led all property types in September, while Malls and Advertising saw the biggest declines
- Large cap REITs have outperformed small caps by 32.6% over the first three quarters of 2020
REIT Performance
With September’s -4.82% average total return, the REIT sector has now seen monthly losses in 6 of the first 9 months of 2020. Year-to-date REITs have now lost an average of -24.93%. The REIT sector outperformed the NASDAQ (-8.71%) but underperformed the S&P 500 (-3.92%) and Dow Jones Industrial Average (-2.28%) in September. The market cap weighted Vanguard Real Estate ETF (VNQ) outperformed the average REIT in September (-3.41% vs. -4.82%) and has suffered much smaller losses year-to-date (-10.53% vs. –24.93%). The spread between the 2020 FFO multiples of large cap REITs (22.1x) and small cap REITs (7.3x) narrowed slightly in September as multiples fell an average of 0.4 turns for large caps and 0.3 turns for small caps. In this monthly publication, I will provide REIT data on numerous metrics to help readers identify which property types and individual securities currently offer the best opportunities to achieve their investment goals.
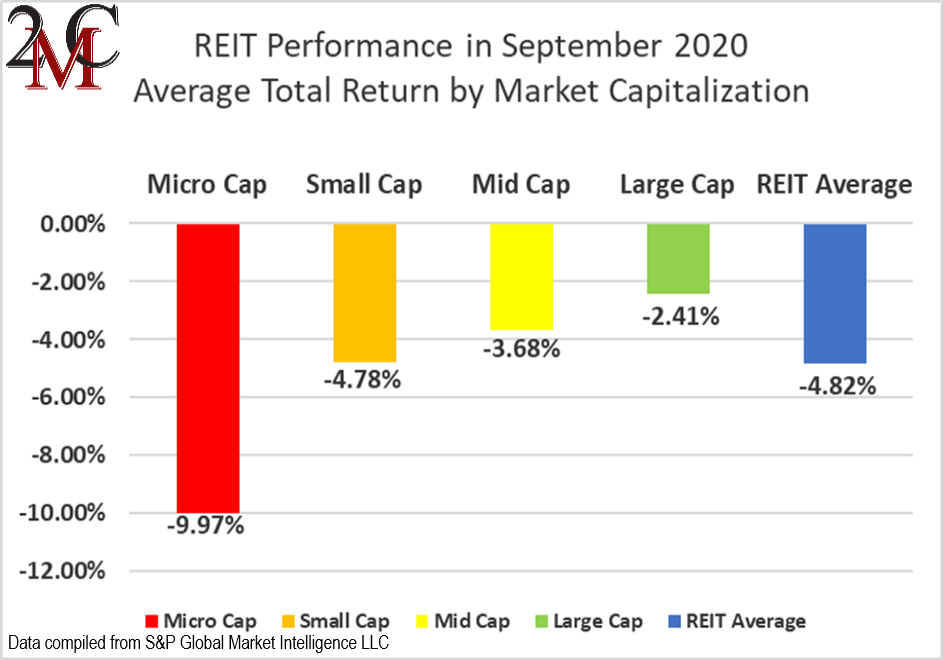
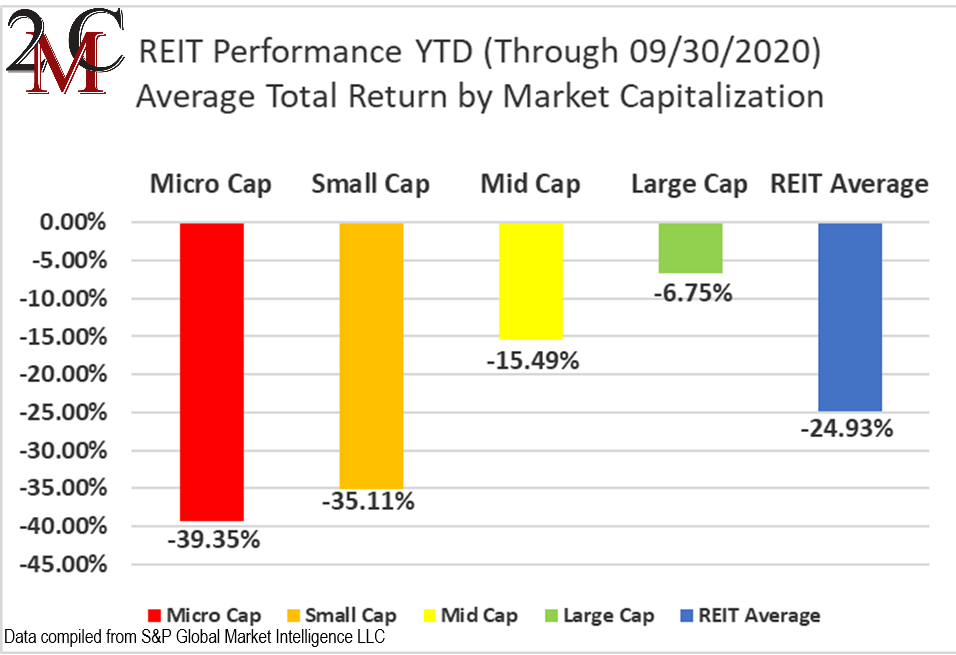
Micro cap (-9.97%) and small cap REITs (-4.78%) saw the biggest losses in September. Large caps (-2.41%) and mid caps (-3.68%) outperformed their smaller peers in September. Year to date there has been a very strong correlation between total return and market cap size. Large cap REITs (-6.75%) have thus far in 2020 outperformed micro caps (-39.35%) by more than 3200 basis points.
4 out of 20 Property Types Yielded Positive Total Returns in September
20% of REIT property types averaged a positive total return in September, with a 16.43% total return spread between the best and worst performing property types. Casino (+3.03%) and Student Housing (+3.01%) had the strongest average returns. All 3 casino REITs saw gains in September, led by VICI Properties (VICI). Due to continued 100% rent collection throughout this pandemic, VICI was able to raise their dividend 10.9% in September. Although the gaming industry is hurting badly due to reduced travel, VICI has performed well thanks to their triple net contracts with tenants that have very strong balance sheets.
Malls (-13.4%) was the worst performing property type in September, weighed down by the -49.65% collapse of Pennsylvania REIT (PEI). Due to the plummeting share price (and thus market capitalization), PEI was removed from the SmallCap 600 in September. This magnified the selloff, because funds and ETFs that follow the SmallCap 600 exited their positions in PEI on this news.


The REIT sector as a whole saw the average P/FFO (2020) fall 0.6 turns during September (from 13.8x down to 13.2x). The average FFO multiples declined for 75% of property types and rose for 25% in September. Land (26.1x) overtook Manufactured Housing (25.6x) as the property type trading at the highest average multiple. Hotels (-4.5x) are trading at a negative FFO multiple as the hotel sector continues to struggle to recover amid the ongoing Covid-19 pandemic. Malls (4.8x), Corrections (5.4x), and Shopping Centers (8.4x) are the only property types trading at a positive single digit multiple.
Performance of Individual Securities
Mall REIT Pennsylvania REIT (PEI) had the lowest total return (-49.65%) of all REITs in September and the 2nd worst performance YTD (-88.57%). Only severely over-leveraged hotel REIT Ashford Hospitality Trust (AHT) has fallen further in 2020 (-94.09%). PEI spent the month of September negotiating with lenders to try to waive covenants and recapitalize the company, but was unable to reach an agreement until October 14th. This agreement, however, will not be valid until support for the agreement is secured from the remaining 20% of lenders as well.
Land REIT Safehold (SAFE) was the best performing REIT in September with a solid +12.24% return. This marks a continuance of the strong steady share price gains for SAFE that the REIT has seen since the beginning of 2019. SAFE is up 55.94% thus far in 2020 and 239.91% since the beginning of 2019. This massive share price increase has been fueled almost entirely by multiple expansion, now trading at a price/FFO of 44x.
18.89% of REITs had a positive return in September and only 19.89% are in the black year to date. During the first nine months of last year, the average REIT had a strong +26.88% return, whereas this year the average REIT has seen a disappointing total return of -24.93%.
Dividend Yield
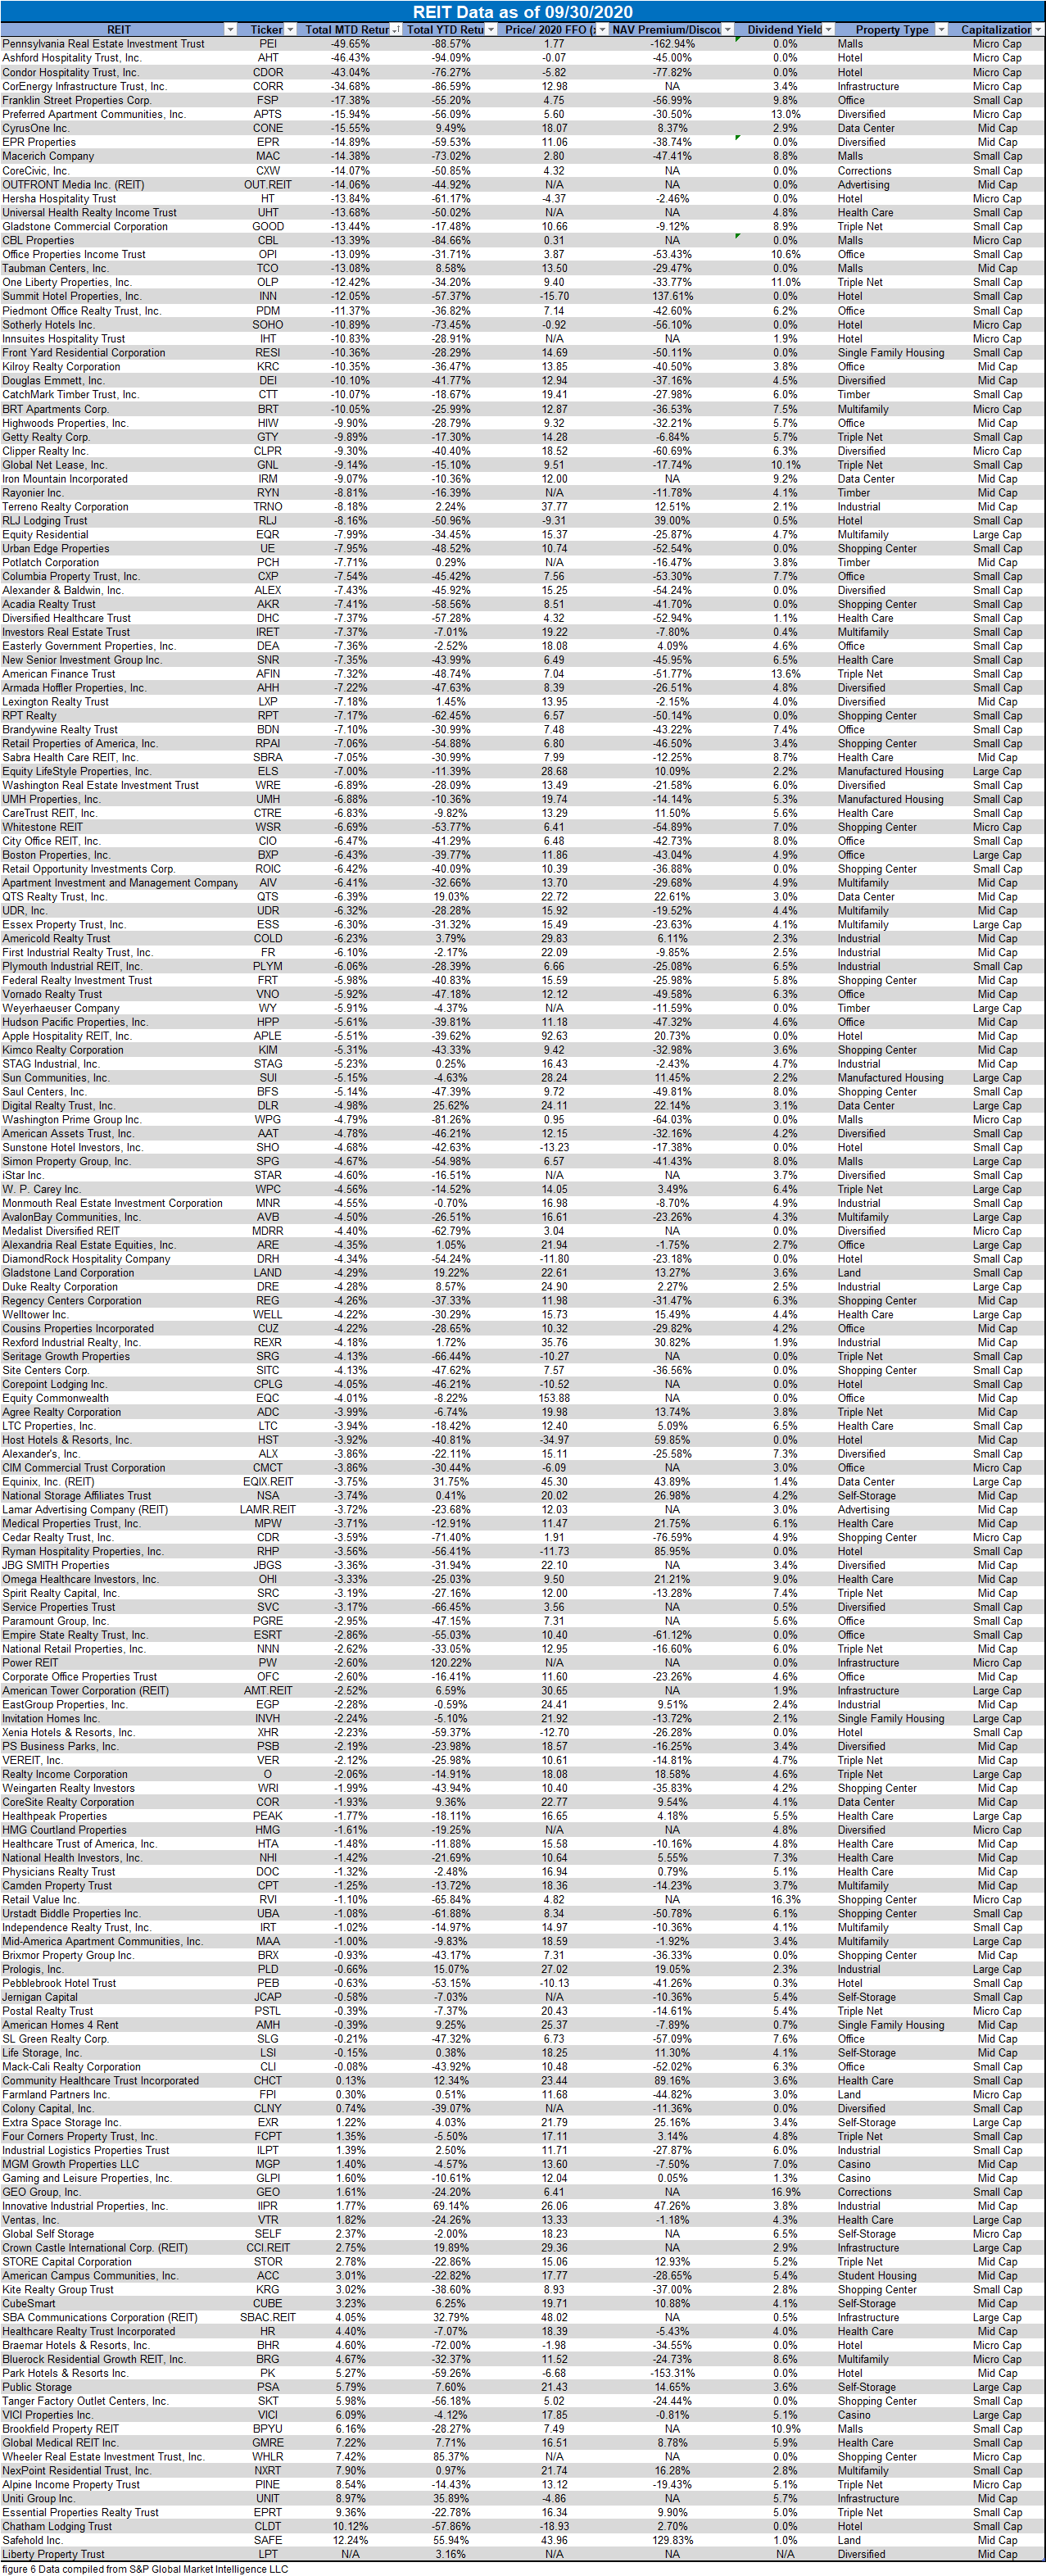
Dividend yield is an important component of a REIT’s total return. The particularly high dividend yields of the REIT sector are, for many investors, the primary reason for investment in this sector. As many REITs are currently trading at share prices well below their NAV, yields are currently quite high for many REITs within the sector. Although a particularly high yield for a REIT may sometimes reflect a disproportionately high risk, there exist opportunities in some cases to capitalize on dividend yields that are sufficiently attractive to justify the underlying risks of the investment. I have included below a table ranking equity REITs from highest dividend yield (as of 09/30/2020) to lowest dividend yield.

Although a REIT’s decision regarding whether to pay a quarterly dividend or a monthly dividend does not reflect on the quality of the company’s fundamentals or operations, a monthly dividend allows for a smoother cash flow to the investor. Below is a list of equity REITs that pay monthly dividends ranked from highest yield to lowest yield.

Valuation
NAV Data as of September 30th, 2020
The REIT sector median discount to Net Asset Value widened in September from -12.2% to -14.6%.
Self Storage REITs (+14.3% premium) overtook Data Centers (+12.9%) as the property type trading at the largest premium to NAV. Office REITs (-41.7% discount) have overtaken both Malls (-41.1%) and Shopping Centers (-36.6%) as the property type trading at the largest NAV discount. 4 of the 10 biggest discounts to NAV currently belong to Office REITs. Despite immense bearishness on the hotel sector, Ryman Hospitality Properties Trust (RHP) currently trades at the largest premium to NAV (+86%). This is due to very heavy downward revisions to consensus NAV.
Macerich (MAC) is now trading at the largest discount to consensus NAV (-65.6%) of any REIT. Macerich (MAC) overtook Empire State Realty Trust (ESRT) as the most discounted REIT after Macerich fell another 14.4% in September.

REIT Premium/Discount to NAV by Property Type
Below is a downloadable data table, which ranks REITs within each property type from the largest discount to the largest premium to NAV. The consensus NAV used for this table is the average of analyst NAV estimates for each REIT. Both the NAV and the share price will change over time, so I will continue to include this table in upcoming issues of The State of REITs with updated consensus NAV estimates for each REIT for which such an estimate is available. A statistical anomaly arose in the data this month and is reflected in this table. The NAV discount of PEI at the end of September was -162.94%, which is mathematically accurate when applying the traditional NAV premium/discount formula, but actually reflects a substantial premium given that PEI now has a negative consensus NAV and positive share price.

Takeaway
The large cap REIT premium (relative to small cap REITs) significantly increased during 2019 and has further expanded during the first three quarters of 2020. Investors are now paying on average over 3 times as much for each dollar of 2020 FFO/share to buy large cap REITs than small cap REITs (22.1x/7.3x – 1 = 202.7%). Excluding hotels, whose earnings have been decimated by both the government-imposed economic shutdown as well as fears of the coronavirus, the small cap REIT average FFO multiple is 10.6x and the large cap REIT premium is 108.5% (22.1X/10.6X – 1 = 108.5%). As can be seen in the table below, there is presently a strong, positive correlation between market cap and FFO multiple.

The table below shows the average premium/discount of REITs of each market cap bucket. This data, much like the data for price/FFO, shows a strong, positive correlation between market cap and Price/NAV. The average Large cap REIT (+0.10%) trades very close to consensus NAV. Mid cap REITs (-8.32%) are trading at a modest discount to NAV. Small cap REITs (-19.53%) trade at a moderate average discount, whereas micro caps on average trade at less than half of their respective NAVs (-50.36%).

Although the REIT sector as a whole saw modest gains in the 3rd quarter of 2020 (+1.3%), most REITs continue to be outpaced by the S&P 500 (+8.9%). In fact, the only REIT property type to outperform the S&P in Q3 2020 was Self Storage (+16.9%).
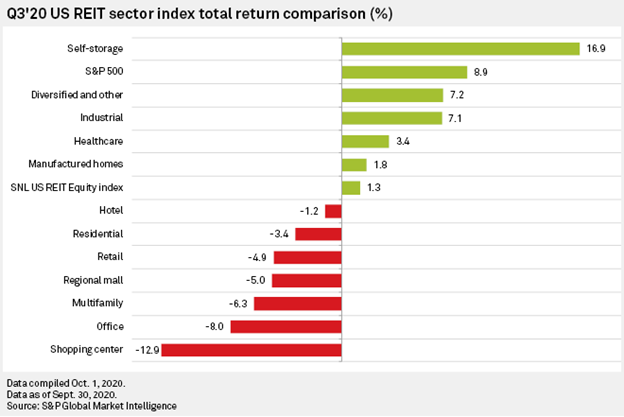

5 of the 25 best performing REITs in Q3 were Self storage REITs. Although Land and Data Centers are two of the best performing property types YTD, neither had a single REIT in the top 25 in Q3. However, there were 3 Hotel REITs and 1 Mall REIT among the top performers, despite the fact that both property types have been far more negatively impacted by the pandemic and are severely underperforming this year. Despite those strong Q3 gains, these REITs remain 34% – 67.7% lower than where they began the year.
This highlights that it is very important to consider a multitude of factors when selecting investments. Some property types are clearly outperforming fundamentally in the current environment, but many of the securities within these property types are fully priced or even richly priced. If an opportunity arises to buy a well-managed REIT at an attractive multiple in a sector with great fundamentals, it may be a great opportunity. However, it’s important for potential investors in such companies to determine at what multiple too much expected growth has already been priced in.
Among the property types that have been most badly beaten down, some REITs may not remain solvent whereas others will recover and experience enormous gains as share prices return toward NAV. Investors who can correctly identify which of these REITs will recover and which will not have the potential to achieve substantial alpha. By carefully analyzing REIT data and industry trends, active investors have the opportunity to outperform ETFs.
Important Notes and Disclosure
All articles are published and provided as an information source for investors capable of making their own investment decisions. None of the information offered should be construed to be advice or a recommendation that any particular security, portfolio of securities, transaction, or investment strategy is suitable for any specific person. The information offered is impersonal and not tailored to the investment needs of any specific person.
We cannot determine whether the content of any article or recommendation is appropriate for any specific person. Readers should contact their financial professional to discuss the suitability of any of the strategies or holdings before implementation in their portfolio. Research and information are provided for informational purposes only and are not intended for trading purposes. NEVER make an investment decision based solely on the information provided in our articles.
We may hold, purchase, or sell positions in securities mentioned in our articles and will not disclose this information to subscribers, nor the time the positions in the securities were acquired. We may liquidate shares in profiled companies at any time without notice. We may also take positions inconsistent with the information and views expressed on our website.
We routinely own and trade the same securities purchased or sold for advisory clients of 2MCAC. This circumstance is communicated to our clients on an ongoing basis. As fiduciaries, we prioritize our clients’ interests above those of our corporate and personal accounts to avoid conflict and adverse selection in trading these commonly held interests.
Past performance does not guarantee future results. Investing in publicly held securities is speculative and involves risk, including the possible loss of principal. Historical returns should not be used as the primary basis for investment decisions. Although the statements of fact and data in this report have been obtained from sources believed to be reliable, 2MCAC does not guarantee their accuracy and assumes no liability or responsibility for any omissions/errors
Commentary may contain forward-looking statements that are by definition uncertain. Actual results may differ materially from our forecasts or estimations, and 2MCAC and its affiliates cannot be held liable for the use of and reliance upon the opinions, estimates, forecasts, and findings in this article.
Through October 2021, The State of REITs was published exclusively on Seeking Alpha by Simon Bowler, Sector Analyst at 2nd Market Capital Services Corporation (2MCSC). Editions subsequent to October 2021 will be published on this website in addition to other platforms that may include Seeking Alpha. 2MCSC was formed in 1989 and provides investment research and consulting services to the financial services industry and the financial media. 2MCSC does not provide investment advice. 2MCSC is a separate entity but related under common ownership to 2nd Market Capital Advisory (2MCAC), a Wisconsin registered investment advisor. Simon Bowler is an investment advisor representative of 2MCAC. Any positive comments made by others should not be construed as an endorsement of the author's abilities to act as an investment advisor.
S&P disclosure: S&P Global Market Intelligence LLC. Contains copyrighted material distributed under license from S&P.