
The State of REITs: November 2020 Edition
- The REIT sector has now endured losses in 7 of the first 10 months of 2020, with a -2.69% total return in October
- Small cap REITs were the hardest hit in October with an average return of -3.46%, while micro caps remained flat with an average return of -0.02%
- Only 26.67% of REIT securities had a positive total return in October
- Single Family Housing REITs and Student Housing REITs led all property types in October, while Corrections and Office had the biggest declines
- Large cap REITs have outperformed small caps by 27.8% over the first 10 months of 2020
REIT Performance
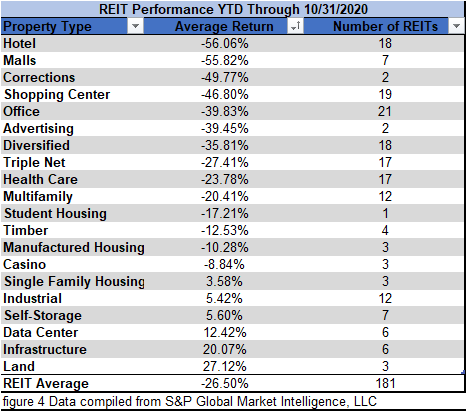
With October’s -2.69% average total return, the REIT sector has now seen monthly losses in 7 of the first 10 months of 2020. Year-to-date REITs have now lost an average of -26.50%. The REIT sector underperformed the NASDAQ (-2.29%) and S&P 500 (-2.66%), but suffered smaller losses than the Dow Jones Industrial Average (-4.61%) in October. The market cap weighted Vanguard Real Estate ETF (VNQ) underperformed the average REIT in October (-3.00% vs. -2.69%), but has suffered much smaller losses year-to-date (-15.39% vs. –26.50%). The spread between the 2020 FFO multiples of large cap REITs (21.5x) and small cap REITs (8.0x) narrowed in October as multiples fell an average of 0.6 turns for large caps and rose 0.7 turns for small caps. In this monthly publication, I will provide REIT data on numerous metrics to help readers identify which property types and individual securities currently offer the best opportunities to achieve their investment goals.


6 out of 20 Property Types Yielded Positive Total Returns in October
30% of REIT property types averaged a positive total return in October, with a 36.27% total return spread between the best and worst performing property types. Single Family Housing (+16.62%) and Student Housing (+7.27%) had the strongest average returns. Single Family Housing was led by Front Yard Residential (RESI) (+53.20%), which announced on October 19th that it would be acquired for $2.4B in an all cash deal. The transaction is expected to close during the first quarter of 2021.
Corrections (-19.65%) saw bigger losses than any other property type in October, with both CoreCivic (CXW) (-19.88%) and GEO Group (GEO) (-19.43%) among the 5 worst performing REITs. With polling throughout October pointing strongly to a Joe Biden victory in November, investors rushed out of an industry that the Democratic party has stated they want to eliminate (private prisons). Given that many of the contracts that both GEO Group and CoreCivic have with the federal government extend many years into the future, much of their cash flow is well protected in the short and medium term. Both prison REITs also have numerous contracts with state and local governments that should not be meaningfully impacted by a change of party in the white house. However, existing federal contracts that reach maturity are not likely to be re-signed under a Biden administration. The uncertainty surrounding the timing and magnitude of potential legislation against the private prison industry may continue to weigh on the sector for some time.


Performance of Individual Securities
Hotel REIT Ashford Hospitality Trust (AHT) suffered the greatest losses (-21.82%) of all REITs in October and has had the worst performance YTD (-95.38%). Ashford continued to decline throughout October after announcing on October 9th the approval of issuing up to 126 million new shares of common stock in an exchange of common stock and cash for preferred shares. Given that AHT had fewer than 15 million common shares outstanding at the time of the announcement, the issuance of 126 million new common shares dramatically changes the composition of ownership. The stock plummeted as investors recognized that the recapitalization created a substantial transfer of control of the company from existing common shareholders to preferred shareholders.
Medalist Diversified REIT (MDRR) was the top performing REIT in October with a stellar +54.70% total return. Although this strong recovery greatly reduced MDRR’s 2020 losses, the YTD total return is still a dismal -42.44%. Immediately after Medalist declared the quarterly preferred dividend of $0.50/share after market on October 13th, the share price took off like a rocket. This drastic upward spike took the share price from $1.17/share at market close on October 13th to $2.85/share at close on October 14th. After that 144% jump, the share price faded back downward through the remainder of the month but remained 54.7% up at month’s end.
26.67% of REITs had a positive return in October and only 18.23% are in the black year to date. During the first ten months of last year, the average REIT had an impressive +29.79% return, whereas this year the average REIT has seen a disappointing total return of -26.50%.

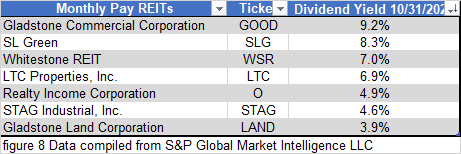
Dividend Yield
Dividend yield is an important component of a REIT’s total return. The particularly high dividend yields of the REIT sector are, for many investors, the primary reason for investment in this sector. As many REITs are currently trading at share prices well below their NAV, yields are currently quite high for many REITs within the sector. Although a particularly high yield for a REIT may sometimes reflect a disproportionately high risk, there exist opportunities in some cases to capitalize on dividend yields that are sufficiently attractive to justify the underlying risks of the investment. I have included below a table ranking equity REITs from highest dividend yield (as of 10/31/2020) to lowest dividend yield.

Valuation
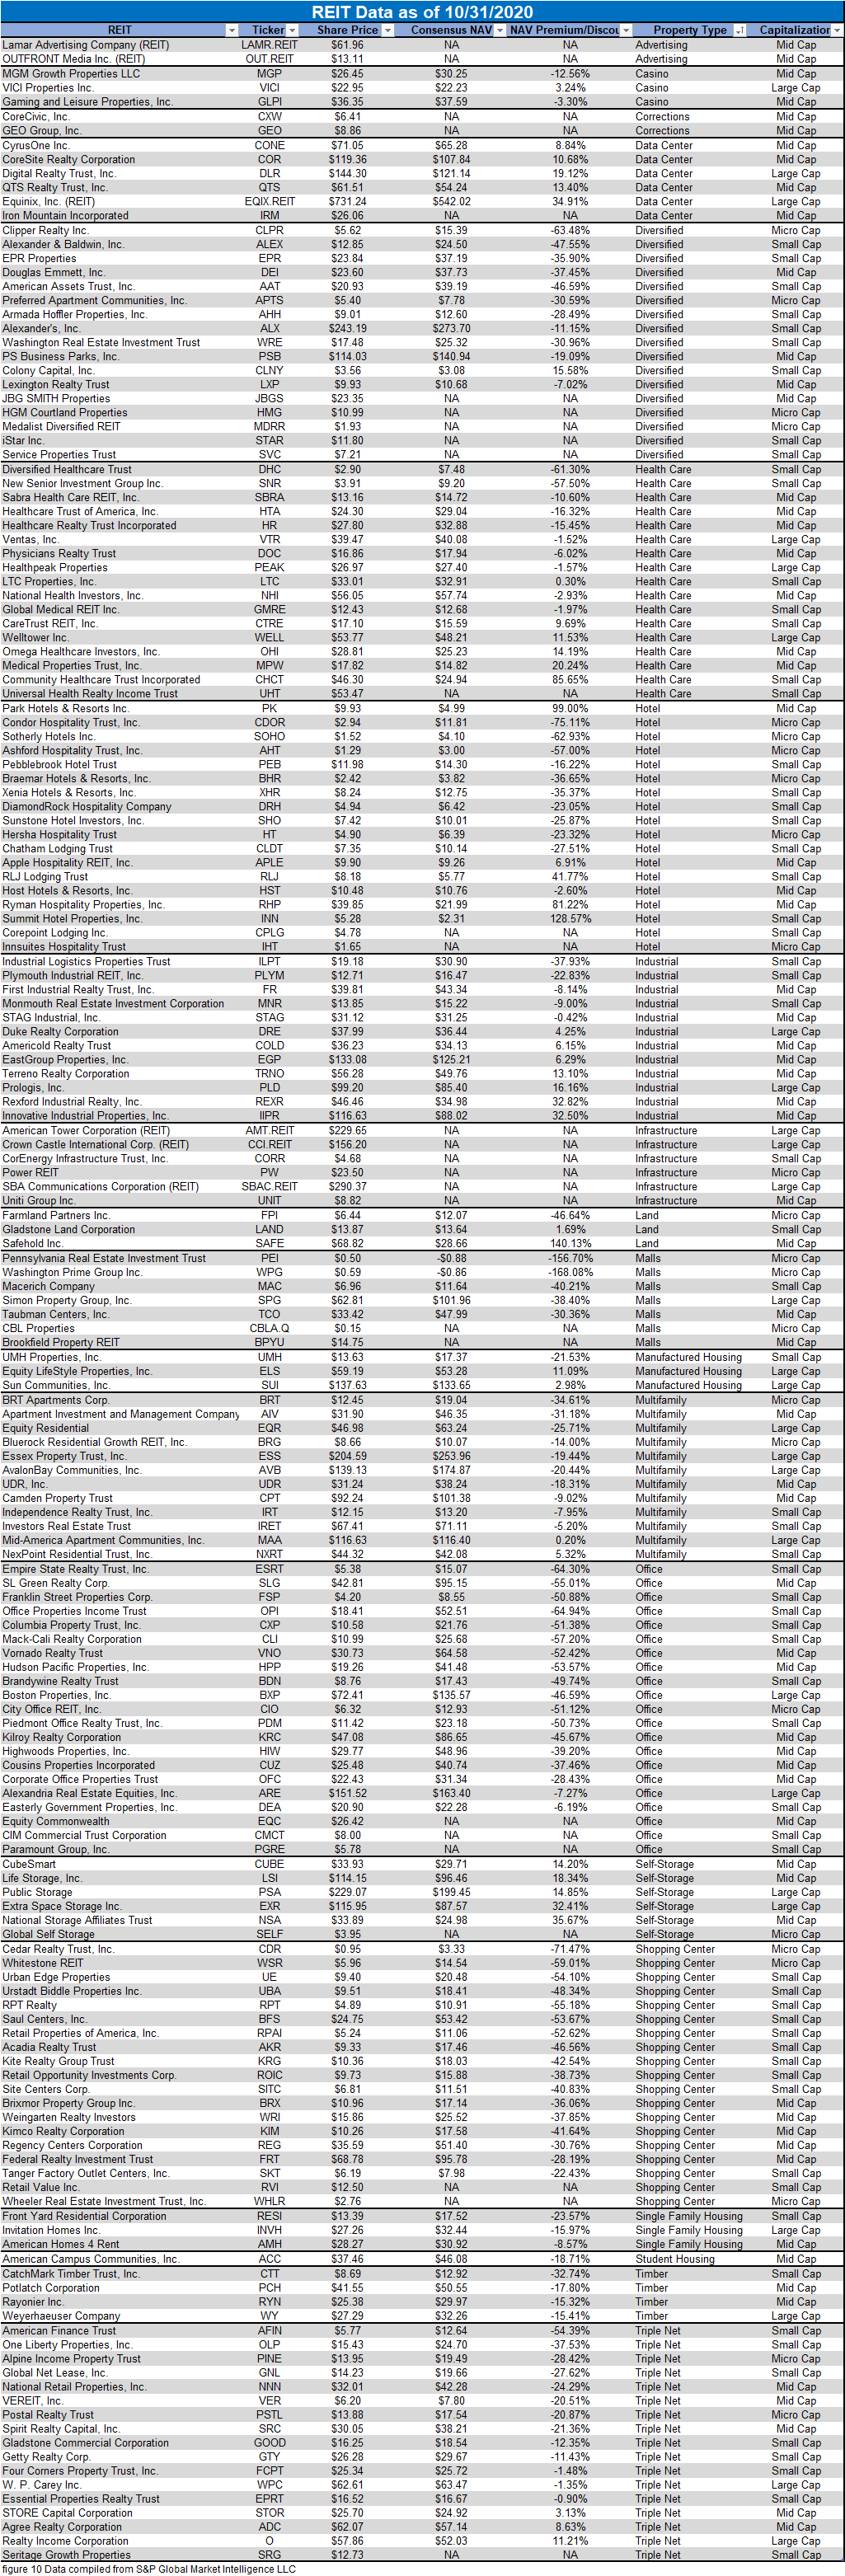
NAV Data as of October 31st, 2020
The REIT sector median discount to Net Asset Value widened in October from -14.6% to -16.7%.
Self Storage REITs (+17.9% premium) continue to trade at a higher premium to NAV than any other property type. Office REITs (-48.7% discount) suffered further losses in October and remain the most discounted property type, followed closely by Shopping Center REITs (-44.8%) and Mall REITs (-40.5%). 5 of the 10 biggest discounts to NAV currently belong to Office REITs: Empire State Realty Trust (ESRT) at -62.6%, Paramount Group (PGRE) at -61.3%, Office Properties Income Trust (OPI) at -58.6%, City Office REIT (CIO) at 53.8% and Hudson Pacific Properties (HPP) at -52.1%. While the Covid-19 induced work from home trend has been a boon for data centers, it has the potential to severely impact Office REITs if the trend continues beyond the end of the pandemic.
New Senior Investment Group (SNR) is now trading at the largest discount to consensus NAV (-65.2%) of any REIT. Investor sentiment on senior housing has plummeted due to the dangerous combination of substantial oversupply of senior housing facilities and the disproportionately negative impact Covid-19 has had on the senior housing industry.

REIT Premium/Discount to NAV by Property Type
Below is a downloadable data table, which ranks REITs within each property type from the largest discount to the largest premium to NAV. The consensus NAV used for this table is the average of analyst NAV estimates for each REIT. Both the NAV and the share price will change over time, so I will continue to include this table in upcoming issues of The State of REITs with updated consensus NAV estimates for each REIT for which such an estimate is available. A statistical anomaly arose in the data this month and is reflected in this table. The NAV discount of PEI at the end of October was -156.7%, which is mathematically accurate when applying the traditional NAV premium/discount formula, but actually reflects a substantial premium given that PEI now has a negative consensus NAV and positive share price.
Takeaway
The large cap REIT premium (relative to small cap REITs) significantly increased during 2019 and has further expanded during the first ten months of 2020. Investors are now paying on average nearly 2.7 times as much for each dollar of 2020 FFO/share to buy large cap REITs than small cap REITs (21.5x/8.0x – 1 = 168.8%). Excluding hotels, whose earnings have been decimated by both the government-imposed economic shutdown as well as fears of the coronavirus, the small cap REIT average FFO multiple is 10.6x and the large cap REIT premium is 108.5% (21.5X/10.6X – 1 = 102.8%). As can be seen in the table below, there is presently a strong, positive correlation between market cap and FFO multiple.

The table below shows the average premium/discount of REITs of each market cap bucket. This data, much like the data for price/FFO, shows a strong, positive correlation between market cap and Price/NAV. The average Large cap REIT (-1.38%) trades very close to consensus NAV. Mid cap REITs (-5.06%) are trading at a modest discount to NAV. Small cap REITs (-24.25%) trade at a moderate average discount, whereas micro caps on average trade at less than half of their respective NAVs (-58.82%).

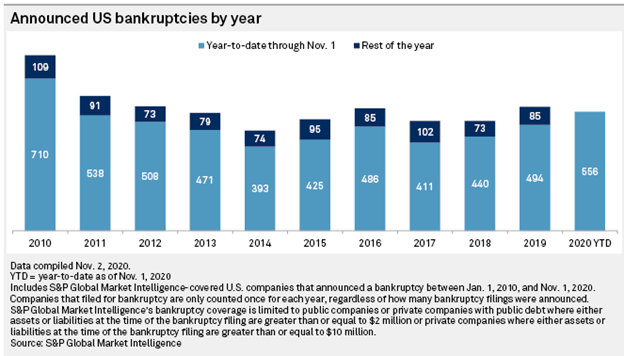
Bankruptcies are unsurprisingly higher over the first 10 months of 2020 than they were in the first 10 months of any year since 2010. As of November 1st, 556 bankruptcies have already been announced this year. This compares with only 494 bankruptcies over the same period last year.

Although the potential death of malls has been widely discussed for years, mall REITs have remained afloat and aggressively worked to redevelop their portfolios. In order to fund these redevelopments, most Mall REITs disposed of properties and took on additional leverage. When the Covid-19 pandemic hit the US, governors around the country mandated the closure of malls for months on end. Some Mall REITs lacked the balance sheet strength and flexibility to withstand the impact to cash flows that came from numerous tenants refusing to pay rent for a space in which they were not allowed to operate. This cash flow shortfall proved to be too much for both CBL Properties (CBLA.Q) and Pennsylvania REIT (PEI), with both Mall REITs announcing bankruptcy filings on November 1st.
There may be further REIT bankruptcies on the horizon. Many are already priced accordingly. There are a dozen REITs currently trading at an FFO multiple of less than 5x and another 6 trading at a multiple between -5x and 0x. Some of these REITs could very plausibly see their share prices fall to $0 within the next year or two. If any of these REITs see their cash flows recover, however, there is potential for an outsized total return. If FFO rebounds, it is likely to result in a substantially improved multiple. The multiplicative impact of both rising FFO and a rising multiple on that higher FFO can result in enormous gains. If a dividend is re-instated as well that would further boost total return. Arguably the greatest opportunity in the REIT market right now lies in correctly identifying which of these severely beaten-down REITs will be the ones to recover and which will end up in bankruptcy court. By carefully analyzing REIT data and industry trends, active investors have the opportunity to outperform ETFs.
Important Notes and Disclosure
All articles are published and provided as an information source for investors capable of making their own investment decisions. None of the information offered should be construed to be advice or a recommendation that any particular security, portfolio of securities, transaction, or investment strategy is suitable for any specific person. The information offered is impersonal and not tailored to the investment needs of any specific person.
We cannot determine whether the content of any article or recommendation is appropriate for any specific person. Readers should contact their financial professional to discuss the suitability of any of the strategies or holdings before implementation in their portfolio. Research and information are provided for informational purposes only and are not intended for trading purposes. NEVER make an investment decision based solely on the information provided in our articles.
We may hold, purchase, or sell positions in securities mentioned in our articles and will not disclose this information to subscribers, nor the time the positions in the securities were acquired. We may liquidate shares in profiled companies at any time without notice. We may also take positions inconsistent with the information and views expressed on our website.
We routinely own and trade the same securities purchased or sold for advisory clients of 2MCAC. This circumstance is communicated to our clients on an ongoing basis. As fiduciaries, we prioritize our clients’ interests above those of our corporate and personal accounts to avoid conflict and adverse selection in trading these commonly held interests.
Past performance does not guarantee future results. Investing in publicly held securities is speculative and involves risk, including the possible loss of principal. Historical returns should not be used as the primary basis for investment decisions. Although the statements of fact and data in this report have been obtained from sources believed to be reliable, 2MCAC does not guarantee their accuracy and assumes no liability or responsibility for any omissions/errors
Commentary may contain forward-looking statements that are by definition uncertain. Actual results may differ materially from our forecasts or estimations, and 2MCAC and its affiliates cannot be held liable for the use of and reliance upon the opinions, estimates, forecasts, and findings in this article.
Through October 2021, The State of REITs was published exclusively on Seeking Alpha by Simon Bowler, Sector Analyst at 2nd Market Capital Services Corporation (2MCSC). Editions subsequent to October 2021 will be published on this website in addition to other platforms that may include Seeking Alpha. 2MCSC was formed in 1989 and provides investment research and consulting services to the financial services industry and the financial media. 2MCSC does not provide investment advice. 2MCSC is a separate entity but related under common ownership to 2nd Market Capital Advisory (2MCAC), a Wisconsin registered investment advisor. Simon Bowler is an investment advisor representative of 2MCAC. Any positive comments made by others should not be construed as an endorsement of the author's abilities to act as an investment advisor.
S&P disclosure: S&P Global Market Intelligence LLC. Contains copyrighted material distributed under license from S&P.