
The State of REITs: December 2020 Edition
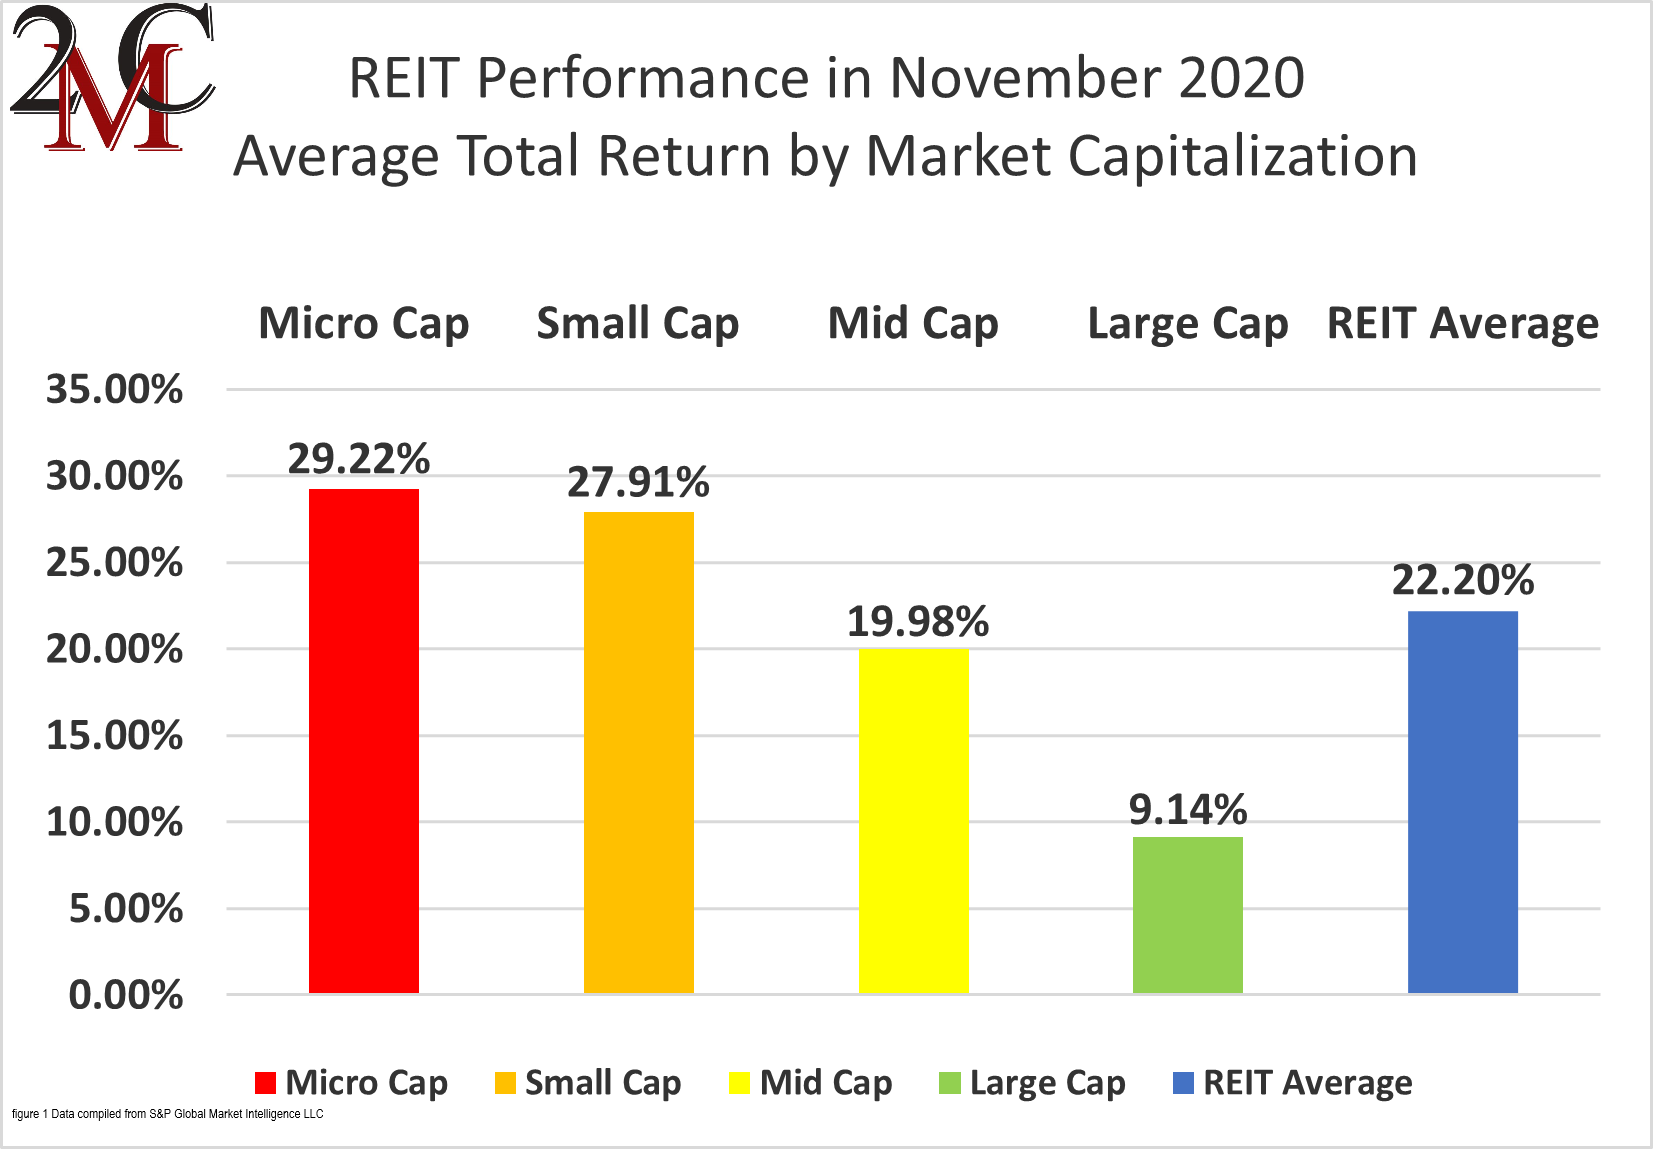
- The REIT sector has now achieved gains in only 4 of the first 11 months of 2020, with a 22.2% total return in November
- Micro cap (+29.22%) and small-cap REITs (+27.91%) surged in November, while large caps (+9.14%) saw smaller gains
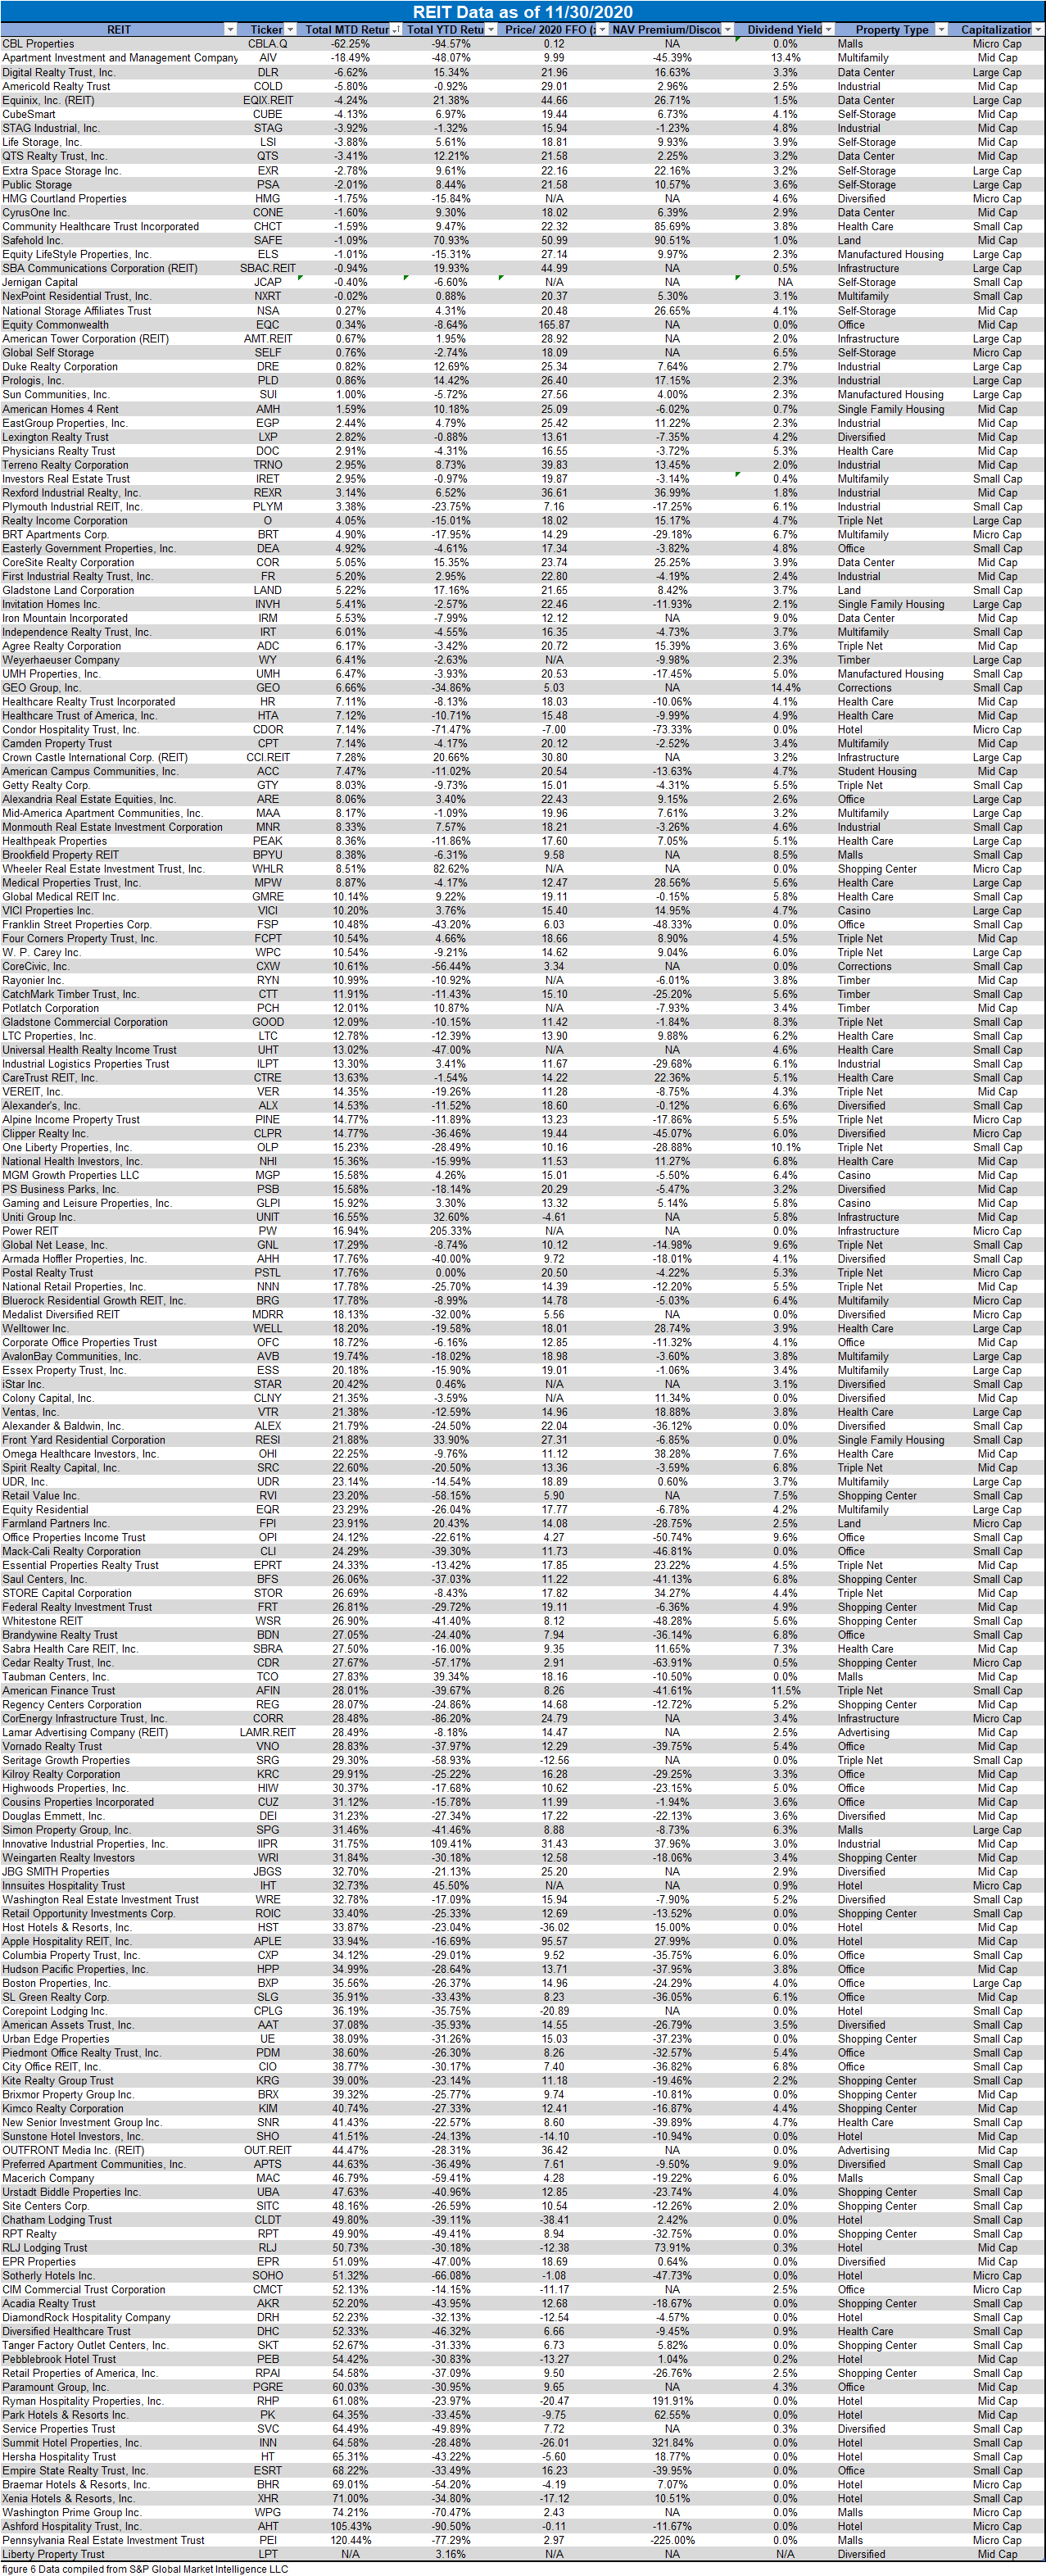
- Only 89.44% of REIT securities had a positive total return in November
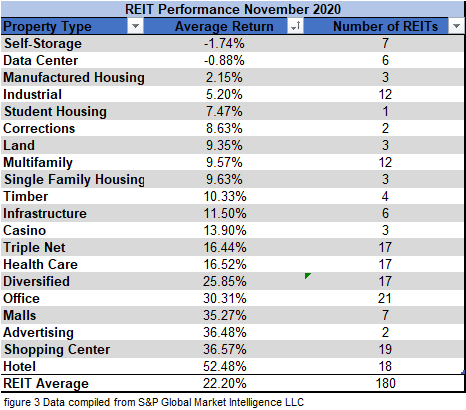
- Hotel REITs and Shopping Center REITs led all property types in November. Self Storage and Data Centers were the only property types in the red
- Large-cap REITs have outperformed small caps by 20.5% over the first 11 months of 2020
REIT Performance
REITs surged in November with a remarkable +22.2% average total return, but this was just the 4th month of gains for the REIT sector over the first 11 months of 2020. Year-to-date REITs have still lost an average of -14.68%. The REIT sector significantly outperformed the Dow Jones Industrial Average (+12.1%), NASDAQ (+11.9%) and S&P 500 (+11.0%) in November. The market cap weighted Vanguard Real Estate ETF (VNQ) badly underperformed the average REIT in November (+9.67% vs. +22.2%), but has still suffered much smaller losses year-to-date (-3.69% vs. -14.68%). The spread between the 2020 FFO multiples of large-cap REITs (22.1x) and small-cap REITs (8.6x) held steady in November as multiples rose an average of 0.6 turns for both large caps and small caps. In this monthly publication, I will provide REIT data on numerous metrics to help readers identify which property types and individual securities currently offer the best opportunities to achieve their investment goals.

18 out of 20 Property Types Yielded Positive Total Returns in November
90% of REIT property types averaged a positive total return in November, with a 54.22% total return spread between the best and worst performing property types. Hotels (+52.48%) and Shopping Centers (+36.57%) had the strongest average returns. Hotels were led by Ashford Hospitality Trust (AHT) (+105.43%), which saw the sharpest rebound on the positive vaccine news. On November 9th, it was announced that the Covid-19 vaccine developed by Pfizer and BioNTech is more than 90% effective. The entire hotel REIT sector took off on the news but remains beaten down from where it began the year.
Self-storage (-1.74%) saw the biggest losses in a month where the vast majority of REITs saw huge gains. The sector was dragged down by declines of -4.13% for CubeSmart (CUBE), -3.88% for Life Storage (LSI), -2.78% for Extra Space Storage (EXR), and -2.01% for Public Storage (PSA). In November, REIT investors largely rotated away from high premium-to-NAV property types such as Self-Storage and Data Centers, instead turning toward deeply discounted property types.


Performance of Individual Securities
On November 1st, two overleveraged mall REITs, CBL Properties (CBL) and Pennsylvania REIT (PEI) declared chapter 11 bankruptcy after failing to withstand the financial impact resulting from the pandemic and magnified by the prolonged lockdowns imposed by governors around the country. These bankruptcies, however, were strikingly different and the market reactions reflected this.
PEI went through a very brief pre-packaged restructuring in order to gain access to $130M of new loans and push back debt maturities. PEI common and preferred shareholders retain their equity ownership in the company. This strategic approach which expanded access to capital and extended debt maturities led to a +120.44% share price surge in November. CBL shareholders, on the other hand, are likely going to get wiped out in the bankruptcy or be left with a fraction of the ownership share they once had. As a result, CBL plummeted yet again in November, suffering the greatest decline (-62.25%) of all REITs. CBL has also had the worst performance of any REIT YTD (-94.57%).
PEI was not the only triple-digit gainer in November. Hotel REIT Ashford Hospitality Trust (AHT) was the 2nd best performing REIT with a remarkable +105.43% total return. Even after the share price more than doubled in November, AHT remains the 2nd worst performing REIT of 2020 with a tragic -90.50% return. In response to the aforementioned announcement of the new vaccine on November 9th, AHT shot up from $1.44 to $4.73 (+228.47%) that day. However, given that the majority of the problems that Ashford is facing cannot be solved with a vaccine, the share price steadily faded back down through the remainder of the month closing at $2.65.
89.44% of REITs had a positive return in November, but only 24.31% are in the black year to date. During the first eleven months of last year, the average REIT had an impressive +29.13% return, whereas this year the average REIT has seen a poor total return of -14.68%.
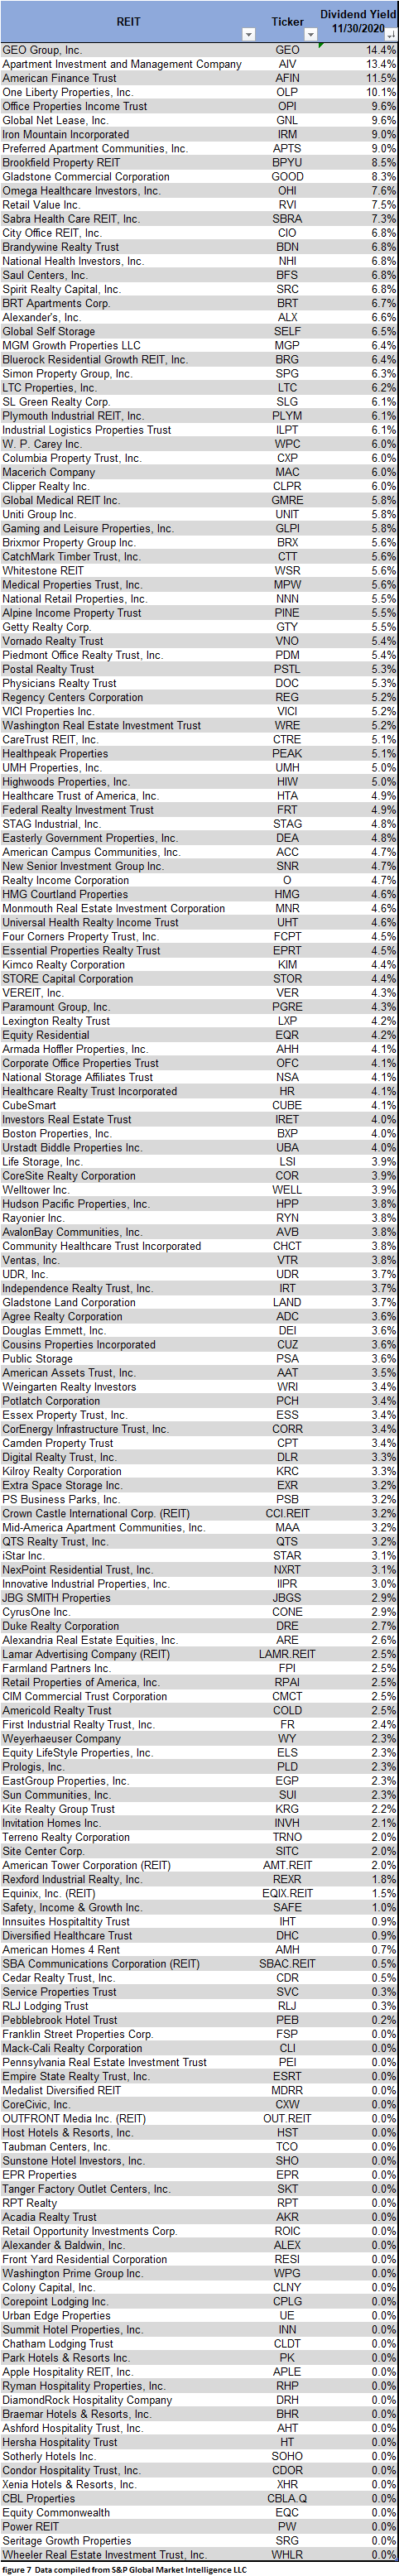
Dividend Yield
Dividend yield is an important component of a REIT’s total return. The particularly high dividend yields of the REIT sector are, for many investors, the primary reason for investment in this sector. As many REITs are currently trading at share prices well below their NAV, yields are currently quite high for many REITs within the sector. Although a particularly high yield for a REIT may sometimes reflect a disproportionately high risk, there exist opportunities in some cases to capitalize on dividend yields that are sufficiently attractive to justify the underlying risks of the investment. I have included below a table ranking equity REITs from highest dividend yield (as of 11/30/2020) to lowest dividend yield.
Although a REIT’s decision regarding whether to pay a quarterly dividend or a monthly dividend does not reflect on the quality of the company’s fundamentals or operations, a monthly dividend allows for a smoother cash flow to the investor. Below is a list of equity REITs that pay monthly dividends ranked from highest yield to lowest yield.

Valuation
NAV Data as of November 30th, 2020
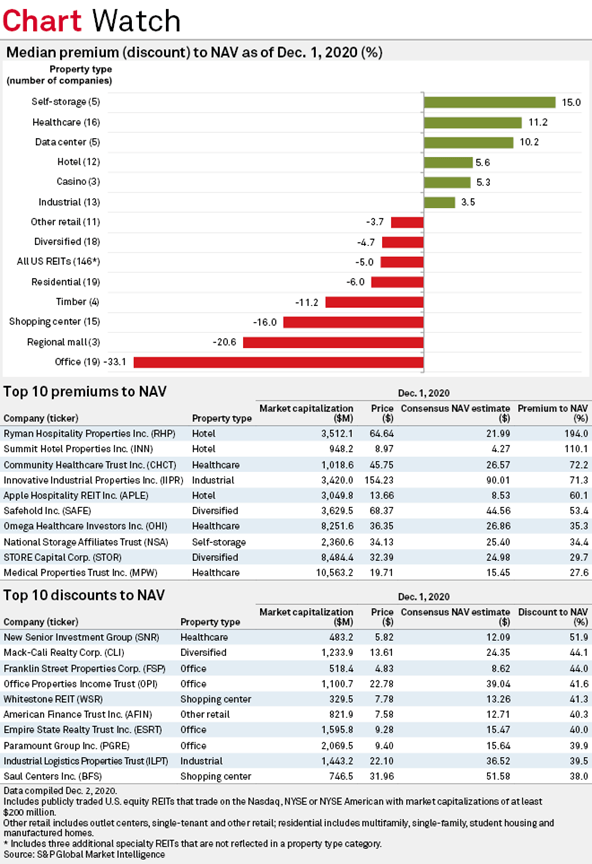
The REIT sector median discount to Net Asset Value narrowed sharply in November from -16.7% to -5%.
Self Storage REITs (+15.0% premium) continue to trade at a higher premium to NAV than any other property type. Health care (+11.2%) and Data Centers (+10.2%) also average double digit premiums. Office REITs (-33.1% discount) saw a partial recovery in November, but remain the most discounted property type, followed by Mall REITs (-20.6%) and Shopping Center REITs (-16.0%). 3 of the 5 REITs trading at the largest premiums to NAV are Hotel REITs. Hotel REIT NAVs have crumbled since the onset of Covid-19 as both average daily rate (ADR) and occupancy rates have collapsed in the industry. With revenue per available room (RevPAR) likely to remain at depressed levels for the foreseeable future, analysts have held back on raising Hotel REIT NAV estimates back up to anywhere near their former levels.
New Senior Investment Group (SNR) continues to trade at the largest discount to consensus NAV (-51.9%) of any REIT. While the upcoming mass distribution of Covid-19 vaccines is a big potential catalyst for a recovery in the senior housing industry, the litany of problems (such as rampant oversupply) that plagued senior housing prior to Covid-19 continue to weigh on the sector.
REIT Premium/Discount to NAV by Property Type
Below is a downloadable data table, which ranks REITs within each property type from the largest discount to the largest premium to NAV. The consensus NAV used for this table is the average of analyst NAV estimates for each REIT. Both the NAV and the share price will change over time, so I will continue to include this table in upcoming issues of The State of REITs with updated consensus NAV estimates for each REIT for which such an estimate is available. A statistical anomaly arose in the data this month and is reflected in this table. The NAV discount of PEI at the end of November was -225%, which is mathematically accurate when applying the traditional NAV premium/discount formula, but actually reflects a substantial premium given that PEI currently has a negative consensus NAV and positive share price.

Takeaway
The large cap REIT premium (relative to small cap REITs) significantly increased during 2019 and has further expanded during the first eleven months of 2020. Investors are now paying on average nearly 2.6 times as much for each dollar of 2020 FFO/share to buy large cap REITs than small cap REITs (22.1x/8.6x – 1 = 157%). Excluding hotels, whose earnings have been decimated by both the government-imposed economic shutdown as well as fears of the coronavirus, the small cap REIT average FFO multiple is 11.8x and the large cap REIT premium is 87.3% (22.1X/11.8X – 1 = 87.3%). As can be seen in the table below, there is presently a strong, positive correlation between market cap and FFO multiple.

The table below shows the average premium/discount of REITs of each market cap bucket. This data, much like the data for price/FFO, shows a strong, positive correlation between market cap and Price/NAV. The average Large cap REIT (+7.53%) and Mid cap REIT (+6.02%) trade at single-digit premiums to consensus NAV. Small cap REITs (-9.14%) trade at a single-digit average discount, whereas micro caps on average trade at just over half of their respective NAVs (-45.39%).

There has been a huge shift in consumer spending behavior in 2020. “Nonstore retailers” (also known as e-commerce) have had a banner year, including a 29.2% year over year increase in November. Part of this was due to fears of getting the coronavirus by shopping near other shoppers, but much of it can also be explained by government lockdowns that mandated the closure of many brick and mortar retail properties for extended periods of time. This represents a rapid acceleration of the existing trend for consumers to commit bigger and bigger portions of their spending to online retailers.

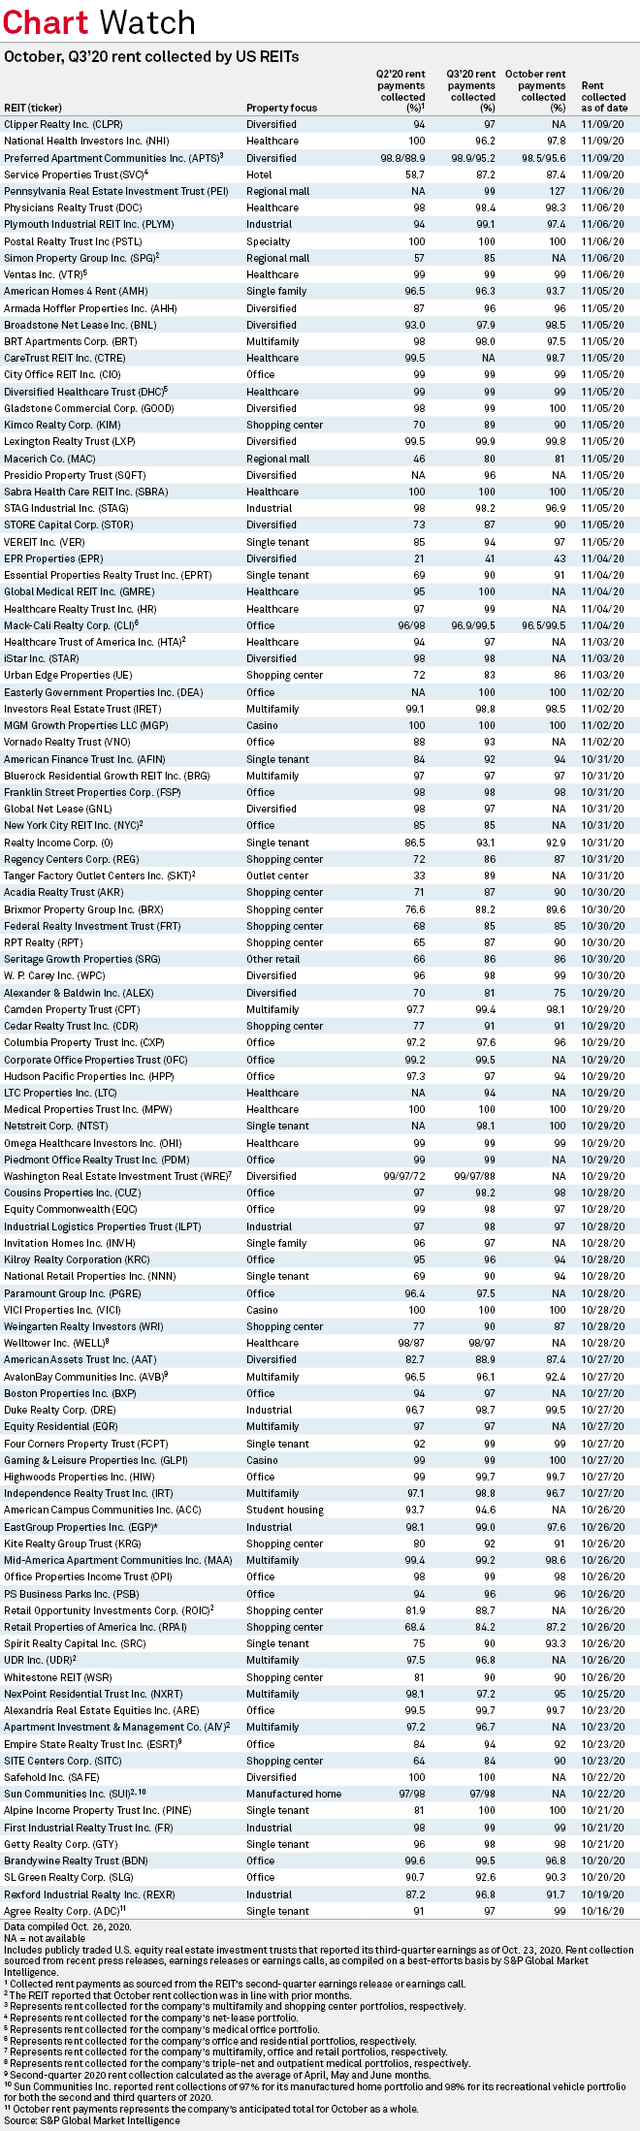
Government-imposed lockdowns that were implemented to slow the spread of the coronavirus shuttered businesses across the country, in many cases permanently. This caused the unemployment rate to skyrocket as businesses shed employees to lowers costs and try to remain solvent. This created a major disruption for landlords of both residential and commercial properties as there were suddenly many tenants that were either unable or unwilling to pay their full rent. Rent collection rates in Q2 were very poor for many REITs, particularly those with retail tenants. However, rent collection has continued to improve as the economy reopens and recovers, allowing some tenants to begin paying current rents in full and start paying back some/all of the rent they missed in prior months.
Some REIT landlords succeeded in retaining all or nearly all of their rental cash flows the whole way through the pandemic. For example, Postal Realty Trust (PSTL) and Medical Properties Trust (MPW) have collected 100% of rent from tenants in both Q2 and Q3. Others, most notably in retail, saw rent collection collapse in Q2, but saw huge recovery in Q3. Tanger Factory Outlet Centers (SKT) has only collected 33% of 2nd quarter rent, but has already collected 89% of 3rd quarter rent. Mall REIT Macerich saw rent collection rise from 46% in Q2 up to 80% in Q3.
With vaccines set to be delivered all around the country and readily accessible to all Americans over upcoming months, we will soon see whether consumers retain their Covid-19 era habits of shopping online, working from home and not traveling nearly as much. Or alternatively will there be enormous pent-up demand for travel, brick and mortar retail shopping and working in the same building as one’s co-workers? Depending upon which of these scenarios play out, different REIT property types stand to benefit. Share prices may quickly adjust accordingly, so there is great benefit to following this closely. By carefully analyzing REIT data and industry trends, active investors have the opportunity to outperform ETFs.
Important Notes and Disclosure
All articles are published and provided as an information source for investors capable of making their own investment decisions. None of the information offered should be construed to be advice or a recommendation that any particular security, portfolio of securities, transaction, or investment strategy is suitable for any specific person. The information offered is impersonal and not tailored to the investment needs of any specific person.
We cannot determine whether the content of any article or recommendation is appropriate for any specific person. Readers should contact their financial professional to discuss the suitability of any of the strategies or holdings before implementation in their portfolio. Research and information are provided for informational purposes only and are not intended for trading purposes. NEVER make an investment decision based solely on the information provided in our articles.
We may hold, purchase, or sell positions in securities mentioned in our articles and will not disclose this information to subscribers, nor the time the positions in the securities were acquired. We may liquidate shares in profiled companies at any time without notice. We may also take positions inconsistent with the information and views expressed on our website.
We routinely own and trade the same securities purchased or sold for advisory clients of 2MCAC. This circumstance is communicated to our clients on an ongoing basis. As fiduciaries, we prioritize our clients’ interests above those of our corporate and personal accounts to avoid conflict and adverse selection in trading these commonly held interests.
Past performance does not guarantee future results. Investing in publicly held securities is speculative and involves risk, including the possible loss of principal. Historical returns should not be used as the primary basis for investment decisions. Although the statements of fact and data in this report have been obtained from sources believed to be reliable, 2MCAC does not guarantee their accuracy and assumes no liability or responsibility for any omissions/errors
Commentary may contain forward-looking statements that are by definition uncertain. Actual results may differ materially from our forecasts or estimations, and 2MCAC and its affiliates cannot be held liable for the use of and reliance upon the opinions, estimates, forecasts, and findings in this article.
Through October 2021, The State of REITs was published exclusively on Seeking Alpha by Simon Bowler, Sector Analyst at 2nd Market Capital Services Corporation (2MCSC). Editions subsequent to October 2021 will be published on this website in addition to other platforms that may include Seeking Alpha. 2MCSC was formed in 1989 and provides investment research and consulting services to the financial services industry and the financial media. 2MCSC does not provide investment advice. 2MCSC is a separate entity but related under common ownership to 2nd Market Capital Advisory (2MCAC), a Wisconsin registered investment advisor. Simon Bowler is an investment advisor representative of 2MCAC. Any positive comments made by others should not be construed as an endorsement of the author's abilities to act as an investment advisor.
S&P disclosure: S&P Global Market Intelligence LLC. Contains copyrighted material distributed under license from S&P.