
The State of REITs: January 2021 Edition
- The average REIT had a negative monthly return in 7 of the 12 months of 2020, with a 3.48% total return in December
- Mid-cap (+4.5%) and micro-cap REITs (+3.45%) outperformed in December, while small caps (+2.43%) saw smaller gains
- 75% of REIT securities had a positive total return in December
- Student Housing and Manufactured Housing REITs led all property types in December. Malls and Corrections REITs were the only property types in the red.
- Large-cap REITs outperformed small caps by 20.28% in 2020
REIT Performance
REITs continued to recover in December with a solid +3.48% average total return, but still finished the year in the red and suffered losses in 7 out of 12 months of 2020. The REIT sector narrowly outperformed the Dow Jones Industrial Average (+3.27%) in December but fell short of the NASDAQ (+5.65%) and S&P 500 (+3.84%). REITs averaged a total return of -11.16% in 2020, severely underperforming the broader market. The Dow Jones Industrial Average (+7.25%), S&P 500 (+18.40%), and in particular the NASDAQ (+43.64%) actually had a very strong 2020 despite the coronavirus and government lockdowns. The market cap weighted Vanguard Real Estate ETF (VNQ) underperformed the average REIT again in December (+1.11% vs. +3.48%), but still suffered much smaller losses in 2020 (-6.18% vs. -11.16%). The spread between the 2021 FFO multiples of large cap REITs (20.8x) and small cap REITs (11.9x) narrowed in December as multiples expanded an average of 3.3 turns for small caps and contracted by 1.3 turns for large caps. In this monthly publication, I will provide REIT data on numerous metrics to help readers identify which property types and individual securities currently offer the best opportunities to achieve their investment goals.


Mid-cap (+4.50%) and micro-cap REITs (+3.45%) saw the strongest gains in December. Small-cap REITs (+2.43%) continued to recover, but at a slower pace than their peers. Over the course of 2020, however, there was a strong correlation between total return and market cap size. Large cap REITs (-1.39%) outperformed small caps (-21.67%) by more than 2000 basis points.
18 out of 20 Property Types Yielded Positive Total Returns in December
90% of REIT property types averaged a positive total return in December, with a 15.75% total return spread between the best and worst performing property types. Student Housing (+7.46%) and Manufactured Housing (+7.33%) had the strongest average returns. With the distribution of Covid-19 vaccines well underway, student housing may see improving fundamentals as universities begin to transition back from online classes to on-campus classes.
Malls (-8.29%) and Corrections (-6.93%) were the only two property types to suffer losses in December. Corrections REITs continued to see declines leading up to the January presidential transition from President Trump, who has been a strong supporter of the use of private prisons, to President-Elect Joe Biden, who has taken an adversarial approach to the private prison industry (albeit somewhat less hostile than the stances of many of the other 2020 Democratic candidates he defeated in the primary). Corrections REITs are likely to remain volatile in 2021 as the policies of the incoming administration are rolled out.

Land (+44.12%), Infrastructure (+35.05%), Industrial (+21.0%), Single Family Housing (+16.48%), Data Centers (+15.79%), Self-Storage (+8.19%), Casino (+6.60%) and Timber (3.36%) are the only REIT property types that achieved gains in 2020. Corrections (-49.34%) and Malls (-45.78%) averaged losses that were more than four times as severe as those of the REIT sector as a whole. 60% of REIT property types averaged a negative return, with 40% enduring a double-digit negative return in 2020.


The REIT sector as a whole saw the average P/FFO (2021) fall 1.0 turns during December (from 14.3x down to 13.3x). The average FFO multiples rose for 5%, declined for 80% and held steady for 10% of property types in December. There are no longer recent 2021 FFO/share estimates for either of the Advertising REITs. Land (28.2x) and Manufactured Housing (23.6x) currently trade at the highest average multiples. Hotels (-8.9x) continue to trade at a negative FFO multiple as most of the hotel sector has not yet returned to positive FFO/share amid the ongoing Covid-19 pandemic. Corrections (4.2x) and Malls (4.4x) are the only property types trading at only a positive single digit multiple.
Performance of Individual Securities
Apartment Investment and Management (AIV) completed its spinoff of Apartment Income REIT (AIRC) on December 15th. Each AIV shareholder of record received 1 share of AIRC for every AIV share they owned. AIV will retain the apartment community development and redevelopment business, while most of the property portfolio will be spun off into AIRC.
On December 21st, Investors Real Estate Trust (IRET) changed its name and ticker to Centerspace (CSR).
On December 29th, Simon Property Group (SPG) closed on the acquisition of fellow mall REIT Taubman Centers (TCO) for $43.00/share. Although this transaction price was smaller than the $52.50/share that was initially agreed upon pre-pandemic, it was still high enough to yield an impressive +39.96% 2020 return for TCO in what was a brutal year for brick and mortar retail and for malls in particular.
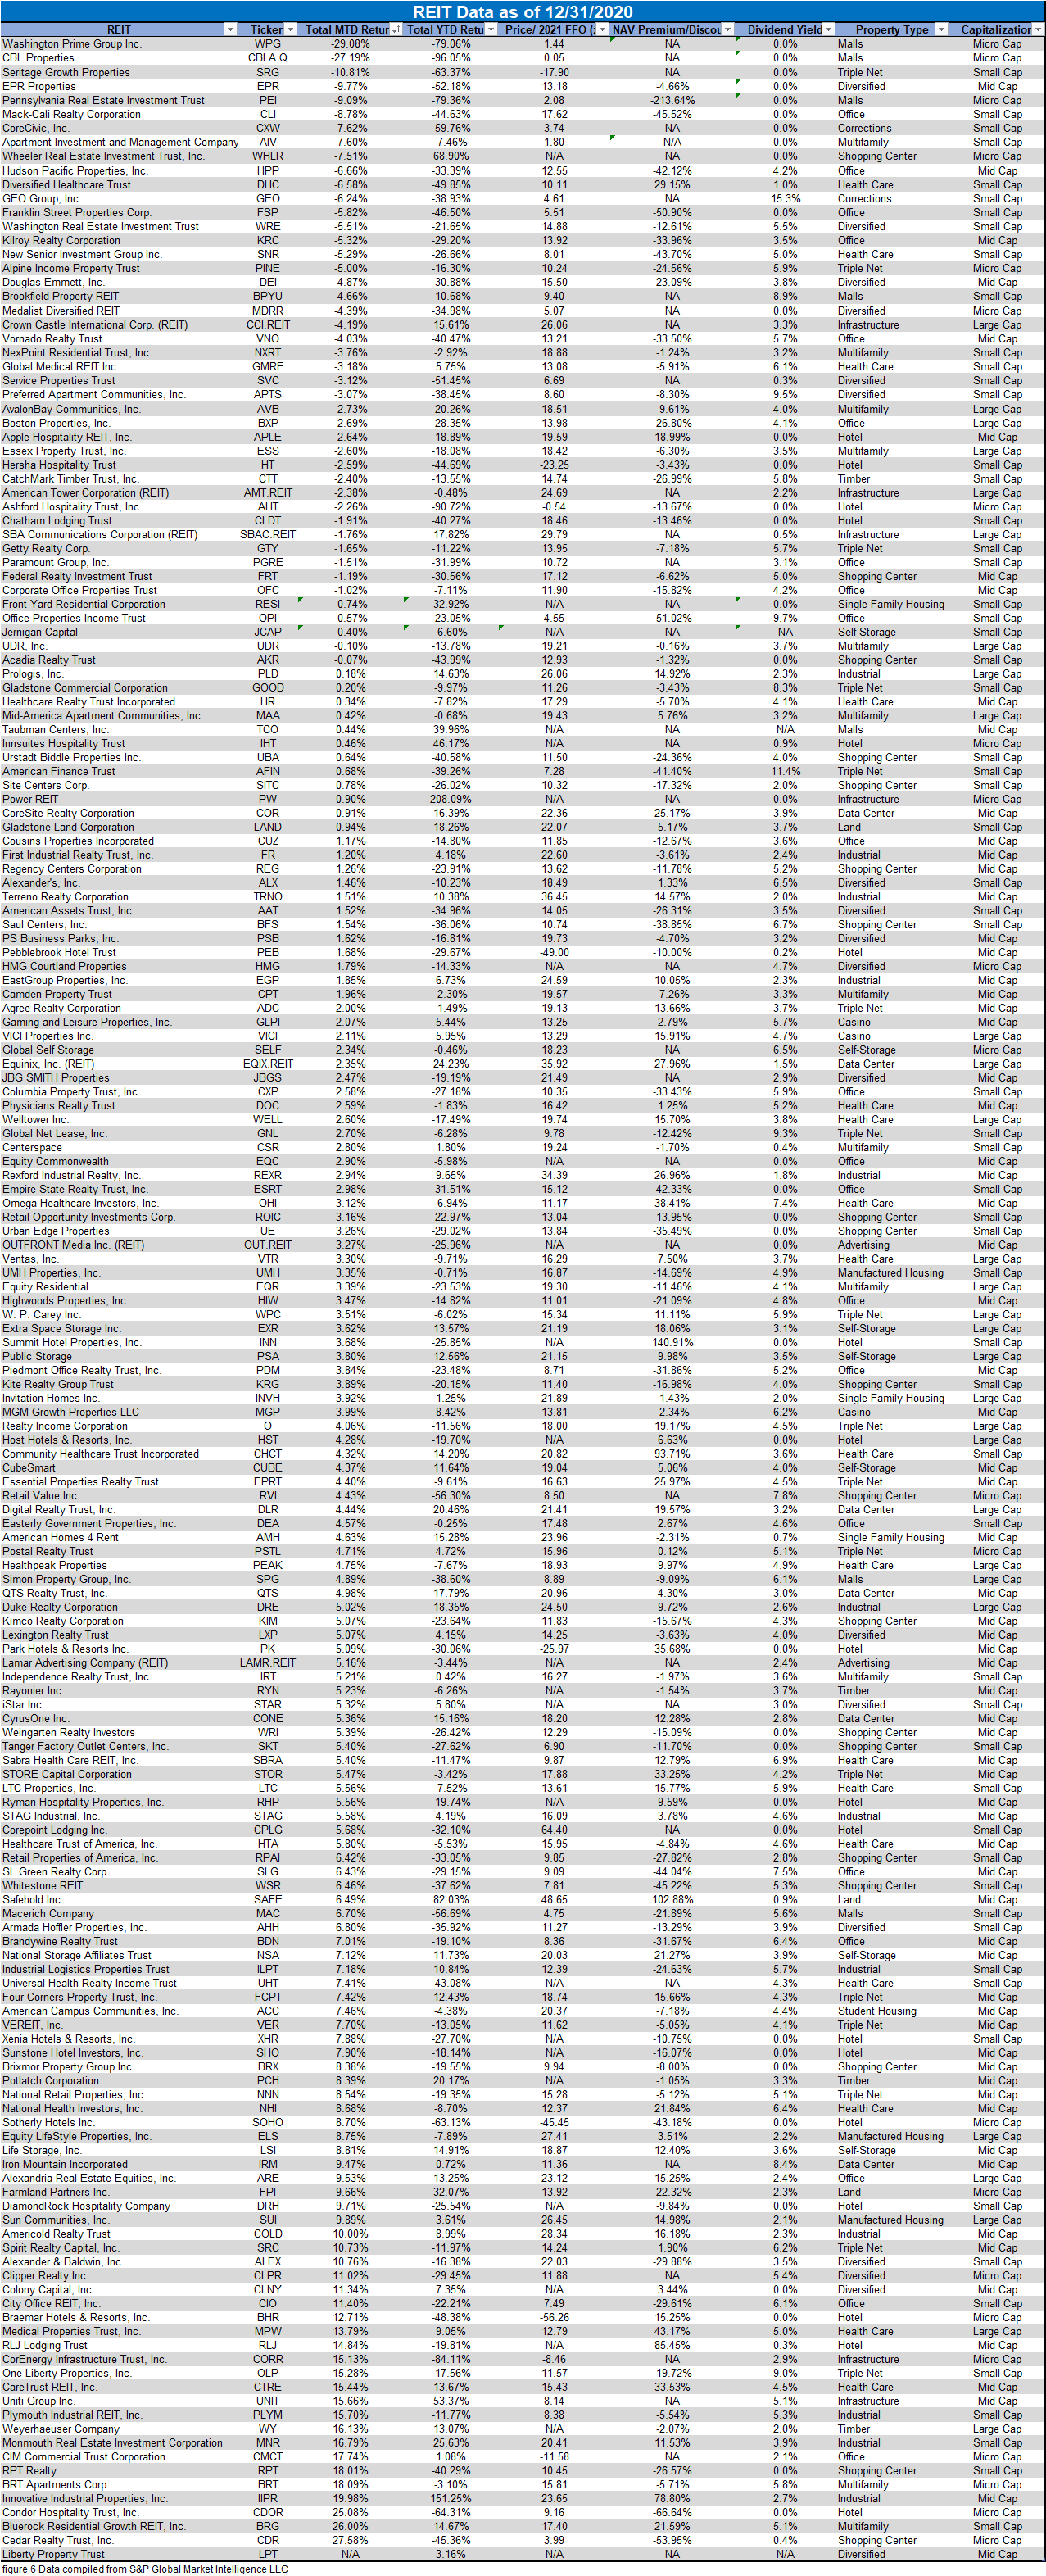
Washington Prime Group (WPG) and CBL Properties (CBLAQ) were the worst performing REITs in December with -29.08% and -27.19% returns respectively. This continued a severe downward trend for both mall REITs with CBL closing the year with the worst total return of 2020 (-96.05%) and WPG finishing with the 5th worst return (-79.06%).
Power REIT (PW) was the top performing REIT of 2020 with a remarkable +208.09% total return. Power REIT expanded into the greenhouse cannabis cultivation space last year, which investors rewarded with significant multiple expansion. Although PW does not directly participate in the marijuana industry, its ownership of properties that are leased out for that purpose positions it to capitalize on the enormous growth in that industry.
75.00% of REITs had a positive return in December, but only 30.94% saw gains in 2020. In 2019 the average REIT had a +28.84% total return, but in 2020 the average REIT suffered a loss of -11.16%.
Dividend Yield
Dividend yield is an important component of a REIT’s total return. The particularly high dividend yields of the REIT sector are, for many investors, the primary reason for investment in this sector. As many REITs are currently trading at share prices well below their NAV, yields are currently quite high for many REITs within the sector. Although a particularly high yield for a REIT may sometimes reflect a disproportionately high risk, there exist opportunities in some cases to capitalize on dividend yields that are sufficiently attractive to justify the underlying risks of the investment. I have included below a table ranking equity REITs from highest dividend yield (as of 12/31/2020) to lowest dividend yield.

Although a REIT’s decision regarding whether to pay a quarterly dividend or a monthly dividend does not reflect on the quality of the company’s fundamentals or operations, a monthly dividend allows for a smoother cash flow to the investor. Below is a list of equity REITs that pay monthly dividends ranked from highest yield to lowest yield.

Valuation
NAV Data as of December 31st, 2020
The REIT sector median discount to Net Asset Value narrowed again in December from -5% to -3.9%.
Data Center REITs (+13.1% premium) overtook Self Storage (+12.7%) as the property type trading at the largest premium to NAV. Health care REITs (+11.2%) also average a double-digit premium. Office (-30.2%) and Malls (-28.3%) remain the most discounted property types. 4 of the 10 REITs trading at the largest premiums to NAV are Health Care REITs. The health care industry is potentially going to receive substantial stimulus from the incoming Biden administration and also stands to benefit from huge pent-up demand for health care services that have not been accessible due to restrictive government-imposed lockdowns.
5 of the 10 REITs trading at the largest discounts to NAV are Office REITs. Some businesses and employees are very eager to return to the office and resume face-to-face meetings, but others have enjoyed substantial savings through work-from-home and may wish to make that the new normal. Demand for office space will likely remain muted until the lockdowns are lifted and the degree to which work-from-home will persist post-Covid is still uncertain.

REIT Premium/Discount to NAV by Property Type
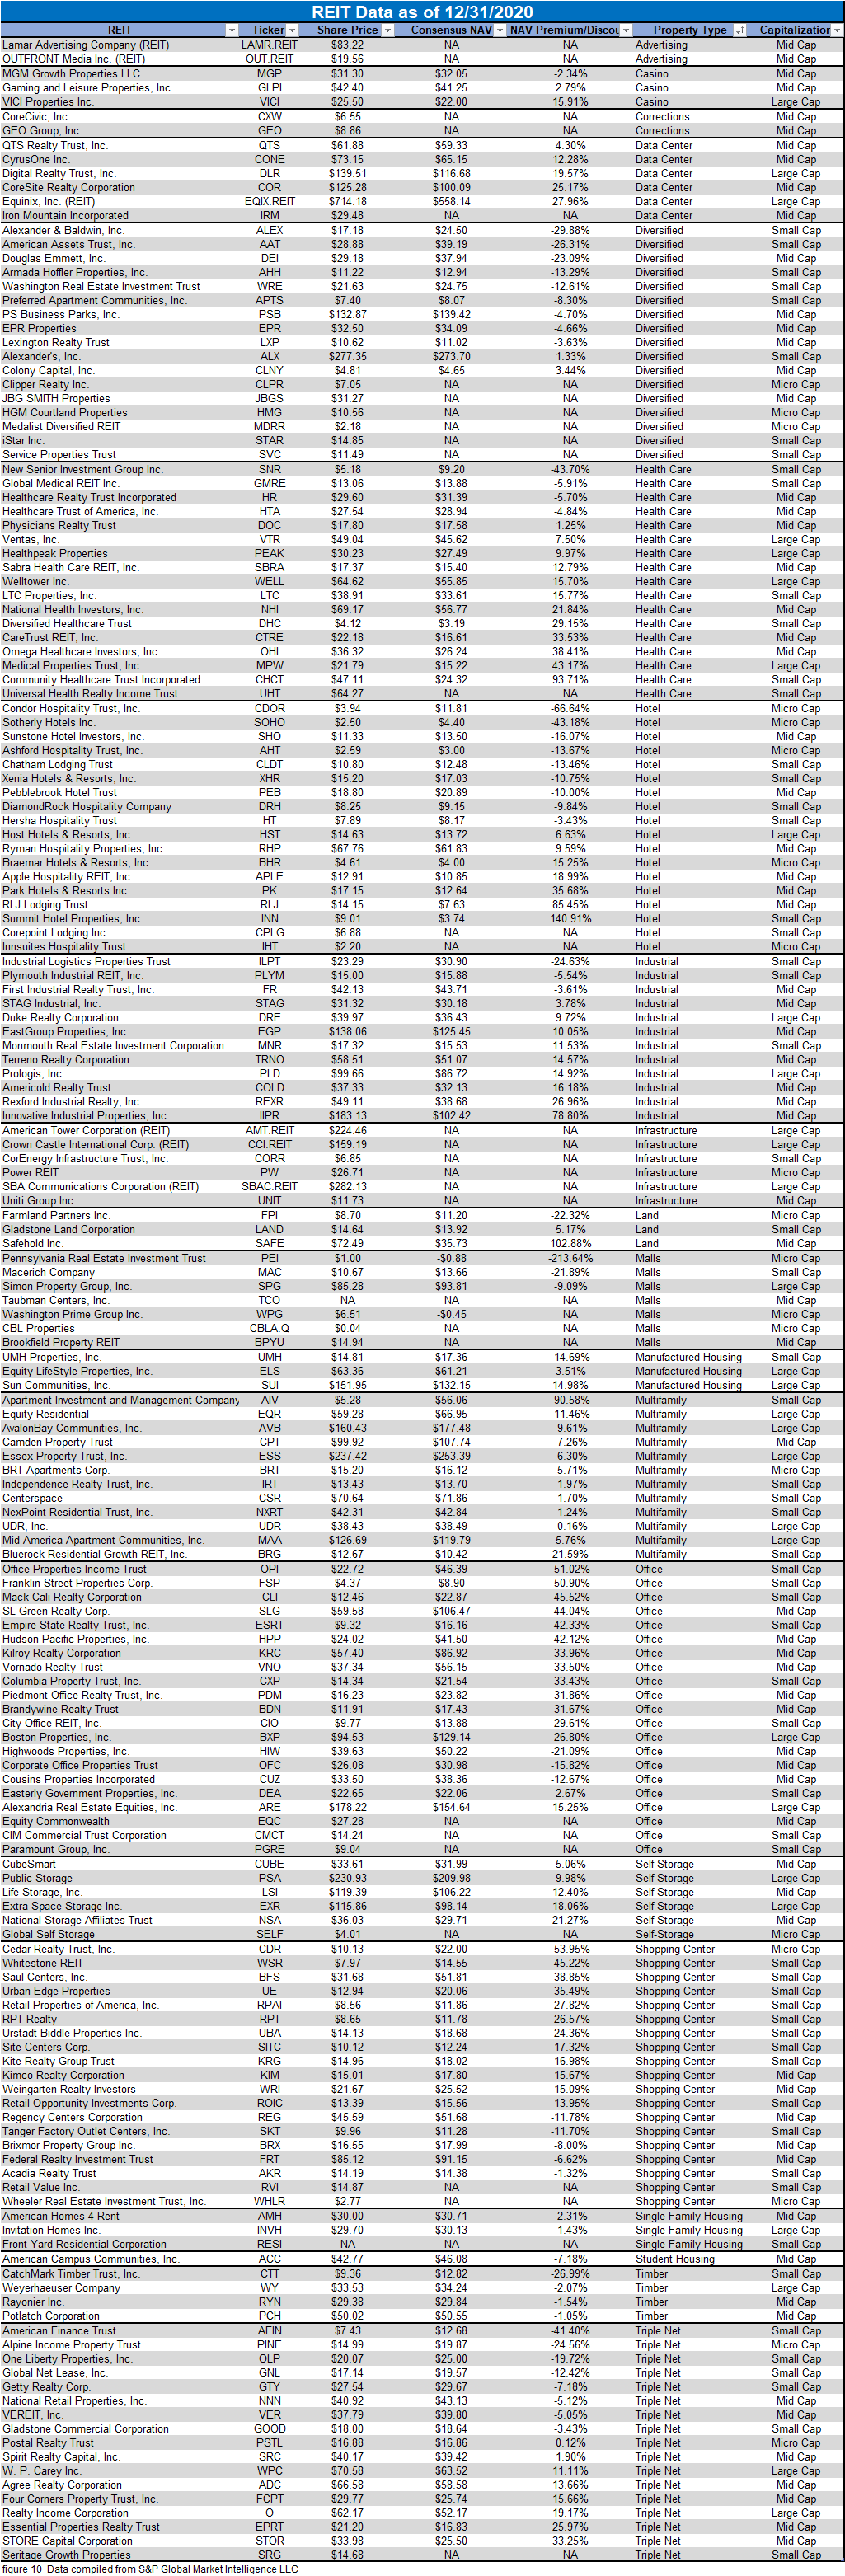
Below is a downloadable data table, which ranks REITs within each property type from the largest discount to the largest premium to NAV. The consensus NAV used for this table is the average of analyst NAV estimates for each REIT. Both the NAV and the share price will change over time, so I will continue to include this table in upcoming issues of The State of REITs with updated consensus NAV estimates for each REIT for which such an estimate is available. A statistical anomaly arose in the data this month and is reflected in this table. The NAV discount of PEI at the end of December was -213.64%, which is mathematically accurate when applying the traditional NAV premium/discount formula, but actually reflects a substantial premium given that PEI currently has a negative consensus NAV and positive share price.
Takeaway
The large cap REIT premium (relative to small cap REITs) significantly increased during 2019 and further expanded during 2020. Investors are now paying on average nearly 75% more for each dollar of 2021 FFO/share to buy large cap REITs than small cap REITs (20.8x/11.9x – 1 = 74.8%). As can be seen in the table below, there is presently a strong, positive correlation between market cap and FFO multiple.

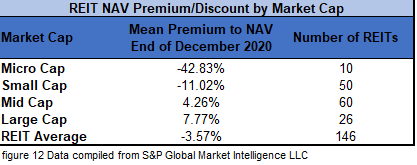
The table below shows the average premium/discount of REITs of each market cap bucket. This data, much like the data for price/FFO, shows a strong, positive correlation between market cap and Price/NAV. The average Large cap REIT (+7.77%) and Mid cap REIT (+4.26%) trade at single digit premiums to consensus NAV. Small cap REITs (-11.02%) trade at a moderate discount, whereas micro caps on average trade at just over half of their respective NAVs (-42.83%).
The broader market continues hitting all-time highs on nearly a daily basis, whereas 69.06% of REITs finished 2020 at a lower share price than they began the year. Most REITs trade at modest multiples and only a handful appear to be at multiples that are unsustainably high. Given that outside of a few specific property types (most notably hotels and malls) REIT cash flows are not dramatically different than where they began the year, REITs enter 2021 very attractively priced relative to the broader market. With greater upside potential and higher dividend yields, REITs are well-positioned to outperform the broader market on a total return basis in 2021.
2021 is likely to be a very eventful year for commercial real estate. There is tremendous M&A potential thanks to historically low debt costs, massive multiple spreads and large discounts to NAV. Both private equity and large REITs with access to cheap capital have opportunities for very accretive acquisitions of small and micro cap REITs trading at single-digit multiples and wide discounts to NAV. How long this lucrative M&A window stays open will depend greatly on the pace of economic recovery, which will in turn depend upon the timing of vaccine distributions and end of government-imposed lockdowns. Small and micro cap REITs with beaten down prices, but resilient fundamentals are most likely to attract takeout bids. Investors who correctly identify these acquisition targets can capture the wide spread between current share price and the acquisition price. By carefully analyzing REIT data and industry trends, active investors have the opportunity to outperform ETFs.
Important Notes and Disclosure
All articles are published and provided as an information source for investors capable of making their own investment decisions. None of the information offered should be construed to be advice or a recommendation that any particular security, portfolio of securities, transaction, or investment strategy is suitable for any specific person. The information offered is impersonal and not tailored to the investment needs of any specific person.
We cannot determine whether the content of any article or recommendation is appropriate for any specific person. Readers should contact their financial professional to discuss the suitability of any of the strategies or holdings before implementation in their portfolio. Research and information are provided for informational purposes only and are not intended for trading purposes. NEVER make an investment decision based solely on the information provided in our articles.
We may hold, purchase, or sell positions in securities mentioned in our articles and will not disclose this information to subscribers, nor the time the positions in the securities were acquired. We may liquidate shares in profiled companies at any time without notice. We may also take positions inconsistent with the information and views expressed on our website.
We routinely own and trade the same securities purchased or sold for advisory clients of 2MCAC. This circumstance is communicated to our clients on an ongoing basis. As fiduciaries, we prioritize our clients’ interests above those of our corporate and personal accounts to avoid conflict and adverse selection in trading these commonly held interests.
Past performance does not guarantee future results. Investing in publicly held securities is speculative and involves risk, including the possible loss of principal. Historical returns should not be used as the primary basis for investment decisions. Although the statements of fact and data in this report have been obtained from sources believed to be reliable, 2MCAC does not guarantee their accuracy and assumes no liability or responsibility for any omissions/errors
Commentary may contain forward-looking statements that are by definition uncertain. Actual results may differ materially from our forecasts or estimations, and 2MCAC and its affiliates cannot be held liable for the use of and reliance upon the opinions, estimates, forecasts, and findings in this article.
Through October 2021, The State of REITs was published exclusively on Seeking Alpha by Simon Bowler, Sector Analyst at 2nd Market Capital Services Corporation (2MCSC). Editions subsequent to October 2021 will be published on this website in addition to other platforms that may include Seeking Alpha. 2MCSC was formed in 1989 and provides investment research and consulting services to the financial services industry and the financial media. 2MCSC does not provide investment advice. 2MCSC is a separate entity but related under common ownership to 2nd Market Capital Advisory (2MCAC), a Wisconsin registered investment advisor. Simon Bowler is an investment advisor representative of 2MCAC. Any positive comments made by others should not be construed as an endorsement of the author's abilities to act as an investment advisor.
S&P disclosure: S&P Global Market Intelligence LLC. Contains copyrighted material distributed under license from S&P.