
The State of REITs: May 2022 Edition
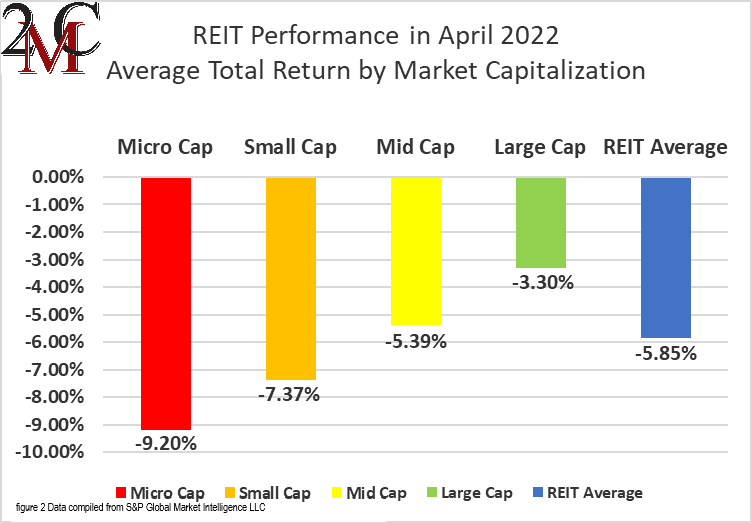
- March’s REIT recovery was short lived as the REIT sector plunged -5.85% in April.
- Large cap (-3.30%) and mid cap (-5.39%) REITs outperformed, whereas small caps (-7.37%) and micro caps (-9.20%) suffered deeper April losses.
- Only 19.88% of REIT securities had a positive total return in April
- Student Housing (+15.54%) and Timber (+4.75%) achieved strong gains in a tough month for the REIT sector. Malls (-13.96%) and Health Care (-11.53%) REITs badly underperformed.
- The average REIT NAV discount widened from -6.62% to -11.94% during April. The median NAV discount also widened from -6.27% to -9.55%.
REIT Performance
The REIT sector is off to a rough start in 2022 with 3 out of the first 4 months in the red. This includes a brutal -5.85% average total return in April. REITs fell short of the Dow Jones Industrial Average (-4.82%), but significantly outperformed the S&P 500 (-8.80%) and the NASDAQ (-13.26%), both of which endured very steep losses in April. The market cap weighted Vanguard Real Estate ETF (VNQ) outperformed the average REIT in April (-4.09% vs. -5.85%), but YTD has underperformed the average REIT (-10.40% vs. -7.01%). The spread between the 2022 FFO multiples of large cap REITs (22.2x) and small cap REITs (15.7x) narrowed in April as multiples decreased by 0.9 turns for large caps and by 0.7 turns for small caps. In this monthly publication, I will provide REIT data on numerous metrics to help readers identify which property types and individual securities currently offer the best opportunities to achieve their investment goals.

3 out of 19 Property Types Yielded Positive Total Returns in April
Only 16% of REIT property types averaged a positive total return in April, with an enormous 29.50% total return spread between the best and worst performing property types. Malls (-13.96%) and Health Care (-11.53%) REITs had the worst average total returns in April. All 4 mall REITs declined by double digits with Macerich (MAC) sinking the furthest in April with a -19.76% return.
Student Housing (+15.54%) and Timber (+4.75%) REITs led all property types in April. The reason for Student Housing’s double-digit gain in a month of brutal losses for most REITs was the announcement on April 19th that Blackstone (BX) will purchase American Campus Communities (ACC), the only publicly traded student housing REIT. On the announcement, ACC’s share price immediately spiked up to around the purchase price of $65.47/share.


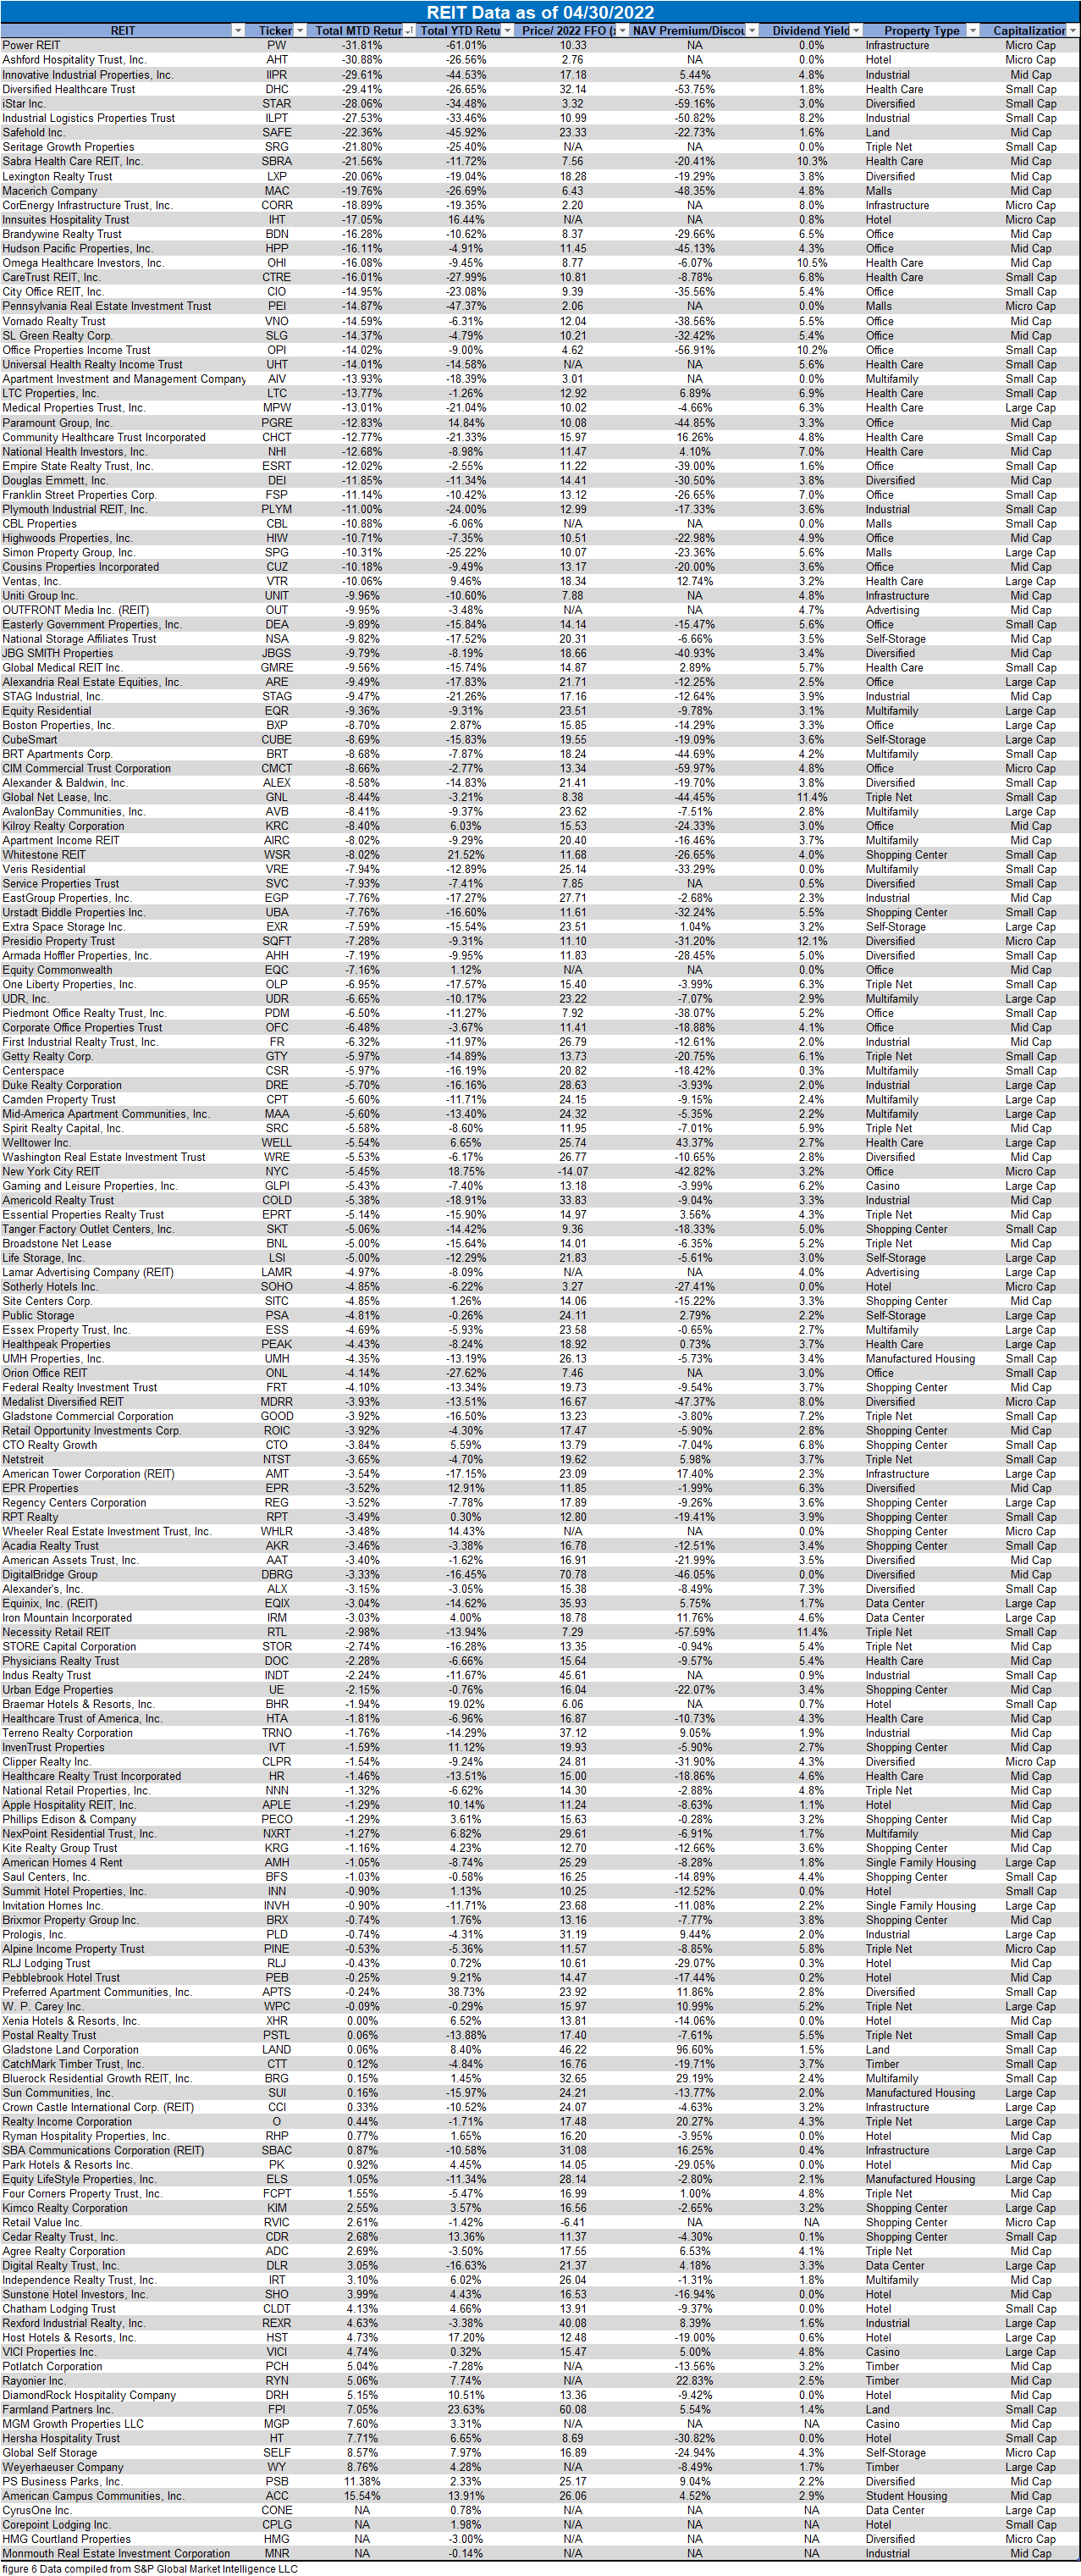
Performance of Individual Securities
MGM Growth Properties (MGP) was acquired by fellow Casino REIT VICI Properties (VICI) on 04/29/2022. MGP shareholders received 1.366 shares of VICI for each share of MGP held. VICI’s CEO Ed Pitoniak announced that VICI is now the largest owner of hotel and conference center real estate in the US.
American Campus Communities (ACC) (+15.54%) shares soared upon announcing on April 19th that they have accepted an offer from Blackstone (BX) to be acquired for $65.47/share. ACC also agreed to suspend its quarterly dividend for the period leading up to the sale date. The transaction is expected to close during Q3 2022.
Power REIT (PW) (-31.81%) not only plummeted to the greatest REIT decline in April, but is now also the worst performing REIT thus far in 2022 (-61.01%). Power REIT soared to higher and higher multiples throughout 2021 and into the first part of January, reaching a share price of $80.05 on January 13th before crashing down to $26.86 by the end of April.
Only 19.88% of REITs had a positive return in April with only 28.00% in the black year to date. During the first four months of last year the average REIT had a +20.49% return, whereas this year the average REIT has seen a -7.01% decline.
Dividend Yield
Dividend yield is an important component of a REIT’s total return. The particularly high dividend yields of the REIT sector are, for many investors, the primary reason for investment in this sector. As many REITs are currently trading at share prices well below their NAV, yields are currently quite high for many REITs within the sector. Although a particularly high yield for a REIT may sometimes reflect a disproportionately high risk, there exist opportunities in some cases to capitalize on dividend yields that are sufficiently attractive to justify the underlying risks of the investment. I have included below a table ranking equity REITs from highest dividend yield (as of 04/30/2022) to lowest dividend yield.

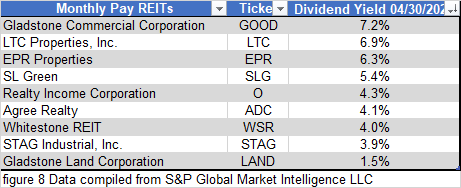
Although a REIT’s decision regarding whether to pay a quarterly dividend or a monthly dividend does not reflect on the quality of the company’s fundamentals or operations, a monthly dividend allows for a smoother cash flow to the investor. Below is a list of equity REITs that pay monthly dividends ranked from highest yield to lowest yield.
REIT Premium/Discount to NAV by Property Type
Below is a downloadable data table, which ranks REITs within each property type from the largest discount to the largest premium to NAV. The consensus NAV used for this table is the average of analyst NAV estimates for each REIT. Both the NAV and the share price will change over time, so I will continue to include this table in upcoming issues of The State of REITs with updated consensus NAV estimates for each REIT for which such an estimate is available.

Takeaway
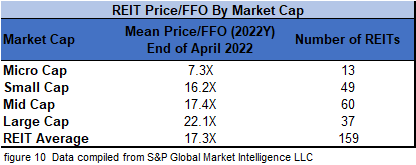
The large cap REIT premium (relative to small cap REITs) widened in April and investors are now paying on average about 41% more for each dollar of 2022 FFO/share to buy large cap REITs than small cap REITs (22.2x/15.7x – 1 = 41.4%). As can be seen in the table below, there is presently a strong positive correlation between market cap and FFO multiple.
The table below shows the average premium/discount of REITs of each market cap bucket. This data, much like the data for price/FFO, shows a strong, positive correlation between market cap and Price/NAV. The average large cap REIT (-0.25%) trades at approximately NAV, while mid cap REITs (-13.04%) and small cap REITs (-16.40%) trade at double-digit discounts. Micro caps on average trade at less than 2/3 of their respective NAVs (-34.64%).

The Covid-19 pandemic and the resulting government-imposed lockdowns had highly disparate impacts on the various REIT property types. REITs in the most severely impacted property types not only saw the sharpest price collapses during the pandemic, but also were the most likely to cut or suspend their dividends. 100% of Mall and Hotel REITs, for example, currently have dividends that are either suspended or lower than they were pre-pandemic. Property types with stronger fundamentals, however, have in many cases been able to continue on the path of dividend growth. 100% of Single Family Housing, Manufactured Housing and Data Center REITs have raised their dividends above EOY 2019 levels.


While some dividend cuts were modest, many REITs in the hotel sector slashed their dividend to a penny. Service Properties Trust (SVC), Park Hotels & Resorts (PK), Pebblebrook (PEB), RLJ Lodging Trust (RLJ) and Braemar Hotels & Resorts (BHR) have not yet restored their pre-pandemic dividends and continue to pay out $0.01/share each quarter.
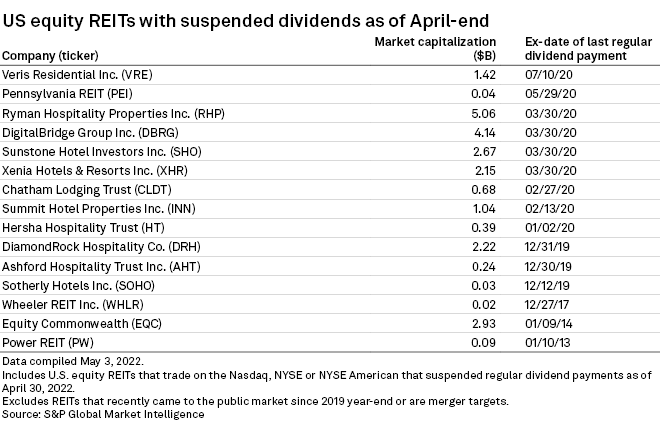
Although many of the REITs that suspended their dividends have since reinstated them, there are still more than a dozen REITs with suspended dividends as of the end of April 2022.

Due to strong balance sheets and SS-NOI growth, many REITs have significantly raised their dividends over this same period. The top 20 biggest raises are included in the table below and include many Industrial REITs such as Innovative Industrial Properties (IIPR) with a +75% dividend hike, Rexford Industrial Realty (REXR) with +70.3%, Prologis (PLD) with +49.1%, EastGroup Properties (EGP) with +46.7%, First Industrial Realty Trust (FR) with +28.3% and Terreno Realty (TRNO) with +25.9%.
With the US economy experiencing -1.4% GDP growth in Q1, many investors fear a recession is around the corner. The worst inflation in 4 decades is severely hampering economic growth. In an effort to tame this runaway inflation, the Fed recently announced a 50-basis point hike to the fed funds rate with many more hikes expected to follow. These hikes raise borrowing costs, thus reducing growth opportunities for many companies. These economic headwinds have injected significant uncertainty and fear into the market. REITs are an inflation hedge both because of asset appreciation and accelerating cash flow growth from rapidly rising tenant rent payments. Although REIT share prices are certainly not immune to the current market volatility, REITs with strong property-level fundamentals and increasing dividends can provide stability to a portfolio’s income.
Important Notes and Disclosure
All articles are published and provided as an information source for investors capable of making their own investment decisions. None of the information offered should be construed to be advice or a recommendation that any particular security, portfolio of securities, transaction, or investment strategy is suitable for any specific person. The information offered is impersonal and not tailored to the investment needs of any specific person.
We cannot determine whether the content of any article or recommendation is appropriate for any specific person. Readers should contact their financial professional to discuss the suitability of any of the strategies or holdings before implementation in their portfolio. Research and information are provided for informational purposes only and are not intended for trading purposes. NEVER make an investment decision based solely on the information provided in our articles.
We may hold, purchase, or sell positions in securities mentioned in our articles and will not disclose this information to subscribers, nor the time the positions in the securities were acquired. We may liquidate shares in profiled companies at any time without notice. We may also take positions inconsistent with the information and views expressed on our website.
We routinely own and trade the same securities purchased or sold for advisory clients of 2MCAC. This circumstance is communicated to our clients on an ongoing basis. As fiduciaries, we prioritize our clients’ interests above those of our corporate and personal accounts to avoid conflict and adverse selection in trading these commonly held interests.
Past performance does not guarantee future results. Investing in publicly held securities is speculative and involves risk, including the possible loss of principal. Historical returns should not be used as the primary basis for investment decisions. Although the statements of fact and data in this report have been obtained from sources believed to be reliable, 2MCAC does not guarantee their accuracy and assumes no liability or responsibility for any omissions/errors
Commentary may contain forward-looking statements that are by definition uncertain. Actual results may differ materially from our forecasts or estimations, and 2MCAC and its affiliates cannot be held liable for the use of and reliance upon the opinions, estimates, forecasts, and findings in this article.
Through October 2021, The State of REITs was published exclusively on Seeking Alpha by Simon Bowler, Sector Analyst at 2nd Market Capital Services Corporation (2MCSC). Editions subsequent to October 2021 will be published on this website in addition to other platforms that may include Seeking Alpha. 2MCSC was formed in 1989 and provides investment research and consulting services to the financial services industry and the financial media. 2MCSC does not provide investment advice. 2MCSC is a separate entity but related under common ownership to 2nd Market Capital Advisory (2MCAC), a Wisconsin registered investment advisor. Simon Bowler is an investment advisor representative of 2MCAC. Any positive comments made by others should not be construed as an endorsement of the author's abilities to act as an investment advisor.
S&P disclosure: S&P Global Market Intelligence LLC. Contains copyrighted material distributed under license from S&P.