
Our Proprietary Portfolio Heading into 2nd quarter – compounding layers of advantage
With inflation running rampant, REITs are a great place to be due to their natural hedging characteristics. The REIT index, however, does not provide the right mix of stocks, with big positions in troubled sectors and omissions in some of the fundamentally stronger areas. A much better mix can be achieved through active stock selection. It gives us a key advantage.
Advantage has been sought since the dawn of civilization.
- Traders would gain advantage by transporting goods from an area where they are low value to a market where they are high value
- A citadel achieves defensive advantage by being built atop a hill
- A chess player gleans tactical advantage by controlling the middle of the board
Capturing advantage is not a novel concept yet so much of the investment world is satisfied with an average return. Over long periods of time the stock market goes up quite consistently so one can achieve an okay return by simply buying a broad market ETF and the masses do. Passive share has now eclipsed active share.
We’re not wired to accept average. It feels wrong to get a market return when there are advantaged investments from which to choose. In assembling this portfolio, we have layered in a series of advantages.
Major advantage #1: No corporate tax
For most of the S&P, investors are taxed twice. The company in which the investor owns stock has to pay corporate tax on its earnings and then the investor has to pay tax on dividends and/or capital gains.
We have intentionally focused our efforts in the REIT space because REITs do not have to pay corporate tax. Thus, investors are only taxed once. This significant and clear advantage has led to REITs outperforming. Over the last 30 years, REITs have beaten the S&P by about 450 percentage points.

The tax advantage remains in place so REITs should continue to outperform in the long run.
This advantage helps all REITs, so by swimming in the REIT pond, each of our stocks comes with a built in advantage.
Major advantage #2: Investing in companies that buy well
Real estate purchases, like any other investments, fall in a spectrum. Some properties will generate a higher return than others and experienced real estate investors can achieve higher IRRs. Some REITs are run by great buyers while others are less skilled. We have intentionally selected REITs that buy properties well and avoid those who don’t.
Major advantage #3: Getting in at a good price
This is the bread and butter that compounds with the other advantages to really improve returns.
Consider a REIT with a skilled buyer who can spot the gems and buy $105 worth of property for $100. If you as an investor buy the REIT at net asset value (NAV) you are getting a good investment because you are functionally getting that $105 property for $100.
However, if you can buy that same REIT at 80% of NAV, you are now getting $105 of property for $80.
This is the layering of advantage – identifying fundamentally prosperous REITs at value prices. We have sought these advantages in every position resulting in a significantly advantaged portfolio.
It shows up in the metrics. The Dow Jones Equity REIT index trades at 23.6X funds from operations (FFO) while our REIT Total Return Portfolio has a P/FFO of 13.8X. The higher cashflows provide a dividend yield that is 34% higher with a lower FFO payout ratio which leaves more capital at the REITs for growth.

***REIT Total Return Portfolio P/FFO is the portfolio’s common stock market value over aggregate FFO of holdings. As aggregate FFO is not readily available for the Dow Jones REIT index P/FFO is the forward estimate provided by S&P Global Market Intelligence. ****Payout ratio calculated as indicated portfolio common stock dividends over indicated FFO of aggregated holdings in the portfolio.
Data as of 3/31/22 for REIT Total Return Portfolio and Dow index. Index data from S&P Global Market Intelligence
History of Portfolio
On July 1, 2016, we invested $100,000 and created an actively managed portfolio of REITs with the goal of generating high total returns from a mix of dividends and capital appreciation. We currently publish quarterly portfolio data and analytics on Seeking Alpha, and for subscribers of our Seeking Alpha Marketplace service, we provide extensive data and analysis.
This is the first time we have offered the opportunity to invest in our proprietary portfolio’s strategy by replicating the activity in the REIT Total Return Portfolio in an investor’s own brokerage account.
Performance
Our initial $100,000 grew into $175,692 as of 3/31/22 representing a total return of 75.69% net of fees**
Fundamentally strong stocks bought at a discount to intrinsic value tend to outperform and this too shows up in the numbers. Over that same 5 and ¾ year period, the MSCI US REIT index returned 53.07%. This equates to outperformance of 2262 basis points.

We are very proud of this outperformance and will continue putting in the work to keep finding strong stocks in an effort to continue to outperform. To that goal, here is our sector positioning heading into the 2nd quarter.
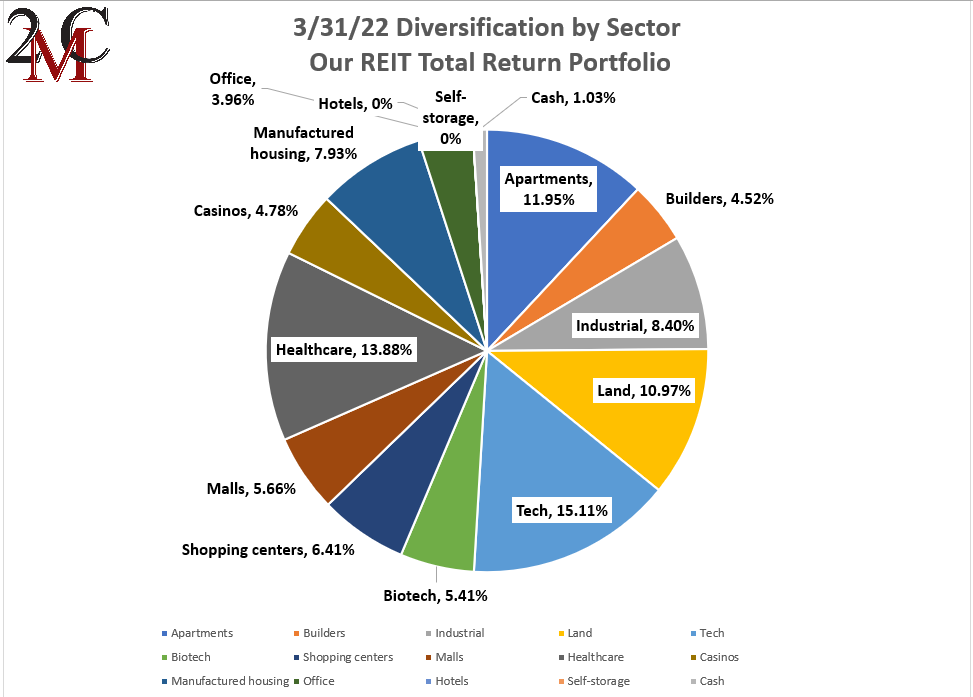
Key Overweights and Underweights Vs the Benchmark
Although tech REITs are the largest sector in our portfolio it is not a substantial overweight because the MSCI US REIT Index (RMS) also has substantial tech exposure. Quite simply, the tech REITs have big market caps. Land is our biggest overweight sector because it is virtually non-existent in the RMS. Manufactured housing is also a big overweight as there are only 3 MH REITs and they make up a tiny fraction of the RMS.
In an inflationary environment, land and manufactured housing are extremely well positioned. I think index REIT investors are really missing out by not participating in these sectors.
Our big underweight sectors are office, hotels, and self-storage. This is very intentional. Each of these property types has wavering demand and significant oversupply of real estate. That is not a fundamental set up to which we want to be exposed.
Evolving economies create opportunity
Our REIT Total Return Portfolio is actively managed to pivot into wherever the opportunity is greatest. We are now offering portfolio mirroring in which the trades in our REIT Total Return Portfolio are automatically executed in client portfolios simultaneously and at the same price.
Important Notes and Disclosure
Material Market and Economic Conditions. March 2022-2023: Significant increases in the Federal Funds Rate by the Federal Reserve have caused REIT market prices to decline more than the broader markets. REITs rely on debt financing to acquire properties and fund their operations; expiring lower-cost debt is being refinanced at higher interest rates due to prevailing market conditions. March 2020: REIT Total Return’s value declined substantially as COVID shut down the economy. It recovered in 2021 as the economy reopened. January 2019: Tax-loss selling’s calendar expired and the government reopened on January 25, 2019. The combined effect caused our shares to rise more than the broader markets. December 2018: Another Fed-Funds rate hike, unresolved US-Chinese trade, a partial government shutdown, and an exaggerated tax-loss selling season put extreme downward pressure on equity prices. All of these factors contributed to diminished liquidity and more significant share price declines in small-cap/value issues; REIT Total Return is focused on small-cap/value issues, so our decline was significantly more precipitous.
Material Conditions, Objectives, and Investment Strategies. REIT Total Return is an actively managed investment portfolio of real estate equities, primarily common and preferred shares of REITs, with an aim to generate high total returns from a mix of dividends and capital appreciation.
All REIT Total Return Portfolio performance information on this page is based on the performance of the Portfolio Manager’s account, using the manager’s own funds. Performance of the Portfolio Manager's account is calculated by Interactive Broker on a daily time-weighted basis, including cash, dividends and earnings distributions, and reflects the deduction of broker commissions (when commissions were charged). Actual client returns will differ. **2nd Market Capital’s advisory fees are simulated and applied retroactively to present the portfolio return “net-of-fees”.
None of the performance information displayed on this page is based on the actual performance of any 2MCAC client account investing in this portfolio. The performance in a 2MCAC client account investing in this portfolio may differ (i.e., be lower or higher) from the performance of the account managing this portfolio and portrayed on this page based on a variety of factors, such as trading restrictions imposed by the client (resulting in different account holdings), time of initial investment, amount of investment, frequency and size of cash flows in and out of the client account, applicable brokerage commissions (when commissions were charged), and different corporate actions. Clients investing in this portfolio may view the actual performance of their investment in this portfolio by logging into their Interactive Brokers account and reviewing their customized dashboard.
Clients may restrict any of the securities traded in their account but should note that any restrictions they place on their investments could affect the performance of their account leading it to perform differently, worse or better, than (a) the above-portrayed account or (b) other client accounts invested in the same portfolio.
Forward-looking statements. Commentary may contain forward-looking statements which are by definition uncertain. Actual results may differ materially from our forecasts or estimations, and 2MCAC cannot be held liable for the use of and reliance upon the opinions, estimates, forecasts, and findings in these documents.
Past performance does not guarantee future results. Investing in publicly held securities is speculative and involves risk, including the possible loss of principal. Historical returns should not be used as the primary basis for investment decisions. Although the statements of fact and data in this commentary have been obtained from sources believed to be reliable, 2MCAC does not guarantee their accuracy and assumes no liability or responsibility for any omissions/errors.
Use of Leverage or Margin. REIT Total Return Portfolio will utilize margin only for trading purposes (the ability to use the proceeds from stock sales immediately for new purchases instead of waiting for settlement), but not for borrowing purposes.
Benchmark Comparison. Our REIT Total Return Portfolio is compared to the Dow Jones Equity REIT Index and the MSCI U.S. REIT index because they are common REIT Indices. The Dow Jones Equity All REIT Index is designed to measure all publicly traded equity real estate investment trusts (REITs) in the Dow Jones U.S. stock universe. The MSCI US REIT Index is comprised of equity real estate investment trusts (REITs) eligible included within the eight Equity REIT Sub-Industries of the Equity Real Estate Investment Trust (REITs) Industry. It is not possible to invest directly in the Dow Jones Equity All REIT Index or MSCI US REIT index. Index returns do not represent the results of actual trading of investible assets/securities. Index returns do not reflect payment of any sales charges or fees an investor may pay to purchase the securities underlying the index. The imposition of these fees and charges would cause the actual performance of the securities to be lower than the Index performance shown. The results portrayed include dividend income. Our REIT Total Return Portfolio may include REITs that are not eligible for inclusion in the Dow Jones Equity All REIT Index or MSCI US REIT Index.
There can be no assurance that a benchmark will remain appropriate over time and 2MCAC will periodically review the benchmark’s appropriateness and decide to use other benchmarks if appropriate.
Expenses. Returns reflect the deduction of any transaction expenses. REIT Total Return's advisory fees are simulated and applied retroactively to present the portfolio return “net-of-fees”.
Calculation Methodology. Returns are calculated by 2MC with data from Interactive Brokers LLC using the Modified Dietz method, a time-weighted measure of performance in which cash flows are weighted based on their timing. Dividends in REIT Total Return are reinvested.
S&P Global Market Intelligence LLC. Contains copyrighted material distributed under license from S&P.