
The State of REITs: February 2022 Edition
- January was a brutal month for nearly all asset classes including the REIT sector, which endured a -5.66% total return in January.
- Micro cap (-1.65%) and small cap REITs (-5.47%) outperformed as mid caps (-5.87%) and large caps (-7.2%) suffered heavier losses.
- Only 12.57% of REIT securities had a positive total return in January
- Health Care (-0.71%) and Hotels (-0.77%) outperformed all REIT property types in January. Land (-12.25%) and Manufactured Housing (-11.45%) REITs suffered the steepest declines.
- The average REIT NAV premium of +0.04% at the end of 2021 dropped to a -7.27% discount during January. The median NAV premium of +2.29% at the end of December flipped to a discount of -5.7% by the close of January.
REIT Performance
After achieving strong gains in 2021, the REIT sector started off 2022 sharply in the other direction with a -5.66% total return in January. Although REITs underperformed the S&P 500 (-5.26%) and the Dow Jones Industrial Average (-3.32%), the REIT sector’s January decline was still far smaller than that of the NASDAQ (-8.98%). The market cap weighted Vanguard Real Estate ETF (VNQ) underperformed the average REIT in January (-8.42% vs. -5.66%). The spread between the 2022 FFO multiples of large cap REITs (22.7x) and small cap REITs (16.1x) narrowed in January as multiples decreased by 2.1 turns for large caps and by only 1 turn for small caps. In this monthly publication, I will provide REIT data on numerous metrics to help readers identify which property types and individual securities currently offer the best opportunities to achieve their investment goals.

Micro cap (-1.65%) and small cap (-5.47%) REITs outperformed their larger peers in January. Mid caps (-5.87%) and large caps (-7.20%) underperformed as they suffered heavy losses at the start of the year. After large caps dominated and micro caps lagged far behind in 2021, January marked a sharp reversal with a strong negative correlation between total return and market cap. Small cap REITs are outperforming large caps by 173 basis points on YTD 2022 total return.
0 out of 19 Property Types Yielded Positive Total Returns in January
100% of REIT property types averaged a negative total return in January, with a narrow 11.53% total return spread between the best and worst performing property types. Land (-12.25%) and Manufactured Housing (-11.45%) REITs had the worst average total return in January. Much of the REIT selloff was driven by investor fears of numerous Fed rate hikes in 2022. With the era of near 0% rates nearing an end, sky-high multiples have become much harder to justify. As a result, the 5 REIT property types that entered 2022 with the highest FFO multiples were the 5 worst performing property types in January.
Health Care (-0.71%) and Hotel (-0.77%) REITs led all property types in January. These property types were largely spared from the selloff due to already having modest valuations. In fact, the five best performing property types in January all entered 2022 trading at multiples at least 3.4 turns lower than the average REIT.

The REIT sector as a whole saw the average P/FFO (2022) decline 1.4 turns in January (from 18.8x down to 17.4x). The average FFO multiples rose for 0% and declined for 100% of property types in January. There are no recent 2022 FFO/share estimates for either of the Advertising REITs. Land (35.6x) and Industrial (28.5x) remain at a higher average multiple than all other REIT property types. Mall (8.1x) REITs are the only property type currently trading at a single digit multiple.

Performance of Individual Securities
HMG/Courtland Properties (HMG) delisted on January 25th as part of a liquidation that was announced in December and approved by shareholders in January.
American Finance Trust (AFIN) rebranded as Necessity Retail REIT (RTL) on February 14th, but it will be referenced by its new name and ticker in all January tables throughout this report.
InnSuites Hospitality Trust (IHT) (+36.23%) continues to experience significant share price volatility, bouncing almost all the way back from a -27.33% total return in December. There was no material news on InnSuites in January, but rather merely a continuation of the wild price volatility that this micro cap continues to experience. These massive price swings these past 2 months have gone sharply in the opposite direction of the REIT sector as a whole, which soared in December and plummeted in January.
Innovative Industrial Properties (IIPR) (-24.62%) saw its valuation begin to fall back toward earth as investors fled extremely high multiple REITs due to expectations for aggressive Fed rate hikes. Even after nearly a quarter of the share price was shaved off by the January selloff, IIPR still trades at the highest NAV premium (+68.27%) of any REIT.
Only 12.57% of REITs had a positive return in January with 12.57% in the black year to date. During the first month of last year, the average REIT had a solid start with a +3.16% return, whereas this year the average REIT has seen a disappointing -5.66%.

Dividend Yield
Dividend yield is an important component of a REIT’s total return. The particularly high dividend yields of the REIT sector are, for many investors, the primary reason for investment in this sector. As many REITs are currently trading at share prices well below their NAV, yields are currently quite high for many REITs within the sector. Although a particularly high yield for a REIT may sometimes reflect a disproportionately high risk, there exist opportunities in some cases to capitalize on dividend yields that are sufficiently attractive to justify the underlying risks of the investment. I have included below a table ranking equity REITs from highest dividend yield (as of 01/31/2022) to lowest dividend yield.

Although a REIT’s decision regarding whether to pay a quarterly dividend or a monthly dividend does not reflect on the quality of the company’s fundamentals or operations, a monthly dividend allows for a smoother cash flow to the investor. Below is a list of equity REITs that pay monthly dividends ranked from highest yield to lowest yield.

REIT Premium/Discount to NAV by Property Type
Below is a downloadable data table, which ranks REITs within each property type from the largest discount to the largest premium to NAV. The consensus NAV used for this table is the average of analyst NAV estimates for each REIT. Both the NAV and the share price will change over time, so I will continue to include this table in upcoming issues of The State of REITs with updated consensus NAV estimates for each REIT for which such an estimate is available.

Takeaway
The large cap REIT premium (relative to small cap REITs) narrowed in the first month of 2022, but investors are still paying on average about 41% more for each dollar of 2022 FFO/share to buy large cap REITs than small cap REITs (22.7x/16.1x – 1 = 41.0%). As can be seen in the table below, there is presently a strong positive correlation between market cap and FFO multiple.

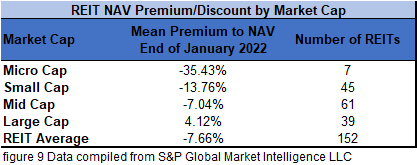
The table below shows the average premium/discount of REITs of each market cap bucket. This data, much like the data for price/FFO, shows a strong, positive correlation between market cap and Price/NAV. The average large cap REIT (+4.12%) trades at a single-digit premium to consensus NAV and mid cap REITs (-7.04%) on average trade at a single-digit discount. Small cap REITs (-13.76%) trade at a double-digit discount, whereas micro caps on average trade at less than 2/3 of their respective NAVs (-35.43%).
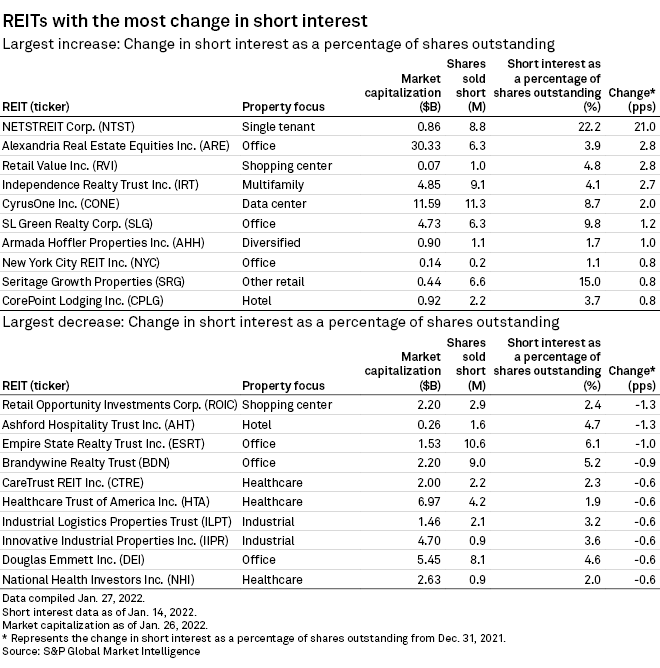
Short interest in the REIT sector increased at the start of the year, ticking up 20 basis points over the 14 days of January. Although short interest in Mall REITs declined slightly, malls remain the most heavily shorted REIT property type. The average short interest for all US REITs rose from 3% to 3.2%, with Land and Advertising REITs seeing the least amount of short interest at only 1.5%.

In the first 2 weeks of the year, NETSTREIT (NTST) saw a 21% spike in short interest and is now the 2nd most heavily shorted REIT. Retail Opportunity Investments Corp. (ROIC) and Ashford Hospitality Trust (AHT) saw the largest declines in short interest.
High short interest can serve as a red flag given that investors short stocks that they have reason to believe will decline meaningfully in price. The potential catalysts that have led investors to heavily short specific REITs vary greatly. For example: the catalysts for shorting GEO Group (GEO), which owns and operates private prisons, are risk of unfavorable government policies at both the federal and state levels, high debt and limited access to capital markets. The catalysts for Pennsylvania REIT (PEI), Seritage Growth Properties (SRG), Tanger Factory Outlet Centers (SKT) and Macerich (MAC) are potential continued troubles in the retail sector and excessive debt that may be difficult to refinance at maturity. For SL Green Realty (SLG) and Vornado (VNO), shorts are betting that New York office won’t sufficiently recover from the hit the sector took from the pandemic and government lockdown

High short interest is often warranted, but it doesn’t automatically mean that a REIT is a bad or excessively risky investment. In select cases, the heavy shorting may not be justified and the bear thesis may fail to play out, resulting in the eventual buying of shares by short investors as they close out their positions. While a short squeeze is not normally anywhere near the magnitude of what we witnessed with GameStop (GME) and AMC Entertainment Holdings (AMC) early last year, it can still be quite favorable to long investors’ total return when both bullish and bearish investors are buying shares of a stock at the same time. It is important to note, however, that if a REIT (or any other company for that matter) is heavily shorted, it is always very worthwhile to fully understand the bear case before considering taking a long (or short) position.

5 REITs that are notably not on the most shorted list are those that are raising their dividends in 2022. Gladstone Commercial (GOOD), Gladstone Land (LAND) and STAG Industrial (STAG) all modestly hiked their monthly dividends in January. Life Storage (LSI) and UMH Properties (UMH) both significantly raised their quarterly dividends as well. These dividend increases are all facilitated by strong fundamentals and improving earnings. With REIT earnings largely coming in strong, the list of REITs hiking their dividends in 2022 is likely to grow longer every month.
Important Notes and Disclosure
All articles are published and provided as an information source for investors capable of making their own investment decisions. None of the information offered should be construed to be advice or a recommendation that any particular security, portfolio of securities, transaction, or investment strategy is suitable for any specific person. The information offered is impersonal and not tailored to the investment needs of any specific person.
We cannot determine whether the content of any article or recommendation is appropriate for any specific person. Readers should contact their financial professional to discuss the suitability of any of the strategies or holdings before implementation in their portfolio. Research and information are provided for informational purposes only and are not intended for trading purposes. NEVER make an investment decision based solely on the information provided in our articles.
We may hold, purchase, or sell positions in securities mentioned in our articles and will not disclose this information to subscribers, nor the time the positions in the securities were acquired. We may liquidate shares in profiled companies at any time without notice. We may also take positions inconsistent with the information and views expressed on our website.
We routinely own and trade the same securities purchased or sold for advisory clients of 2MCAC. This circumstance is communicated to our clients on an ongoing basis. As fiduciaries, we prioritize our clients’ interests above those of our corporate and personal accounts to avoid conflict and adverse selection in trading these commonly held interests.
Past performance does not guarantee future results. Investing in publicly held securities is speculative and involves risk, including the possible loss of principal. Historical returns should not be used as the primary basis for investment decisions. Although the statements of fact and data in this report have been obtained from sources believed to be reliable, 2MCAC does not guarantee their accuracy and assumes no liability or responsibility for any omissions/errors
Commentary may contain forward-looking statements that are by definition uncertain. Actual results may differ materially from our forecasts or estimations, and 2MCAC and its affiliates cannot be held liable for the use of and reliance upon the opinions, estimates, forecasts, and findings in this article.
Through October 2021, The State of REITs was published exclusively on Seeking Alpha by Simon Bowler, Sector Analyst at 2nd Market Capital Services Corporation (2MCSC). Editions subsequent to October 2021 will be published on this website in addition to other platforms that may include Seeking Alpha. 2MCSC was formed in 1989 and provides investment research and consulting services to the financial services industry and the financial media. 2MCSC does not provide investment advice. 2MCSC is a separate entity but related under common ownership to 2nd Market Capital Advisory (2MCAC), a Wisconsin registered investment advisor. Simon Bowler is an investment advisor representative of 2MCAC. Any positive comments made by others should not be construed as an endorsement of the author's abilities to act as an investment advisor.
S&P disclosure: S&P Global Market Intelligence LLC. Contains copyrighted material distributed under license from S&P.