
The State of REITs: September 2022 Edition
- The REIT sector has endured declines in 6 of the first 8 months of 2022, including a -5.29% total return in August.
- Micro cap REITs (+6.9%) outperformed in August, while large caps (-5.17%), small caps (-6.65%), and mid caps (-7.51%) declined.
- Only 15.06% of REIT securities had a positive total return in August.
- Shopping Center (+3.21%) and Self-Storage (+0.78%) REITs managed to stay in the black and led all property types in August. Office (-12.33%) and Diversified (-9.24%) REITs underperformed.
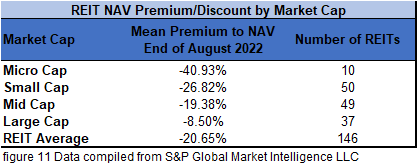
- The average REIT NAV discount widened from -15.24% to -20.28% during August. The median NAV discount also widened from -12.67% to -20.04%
REIT Performance
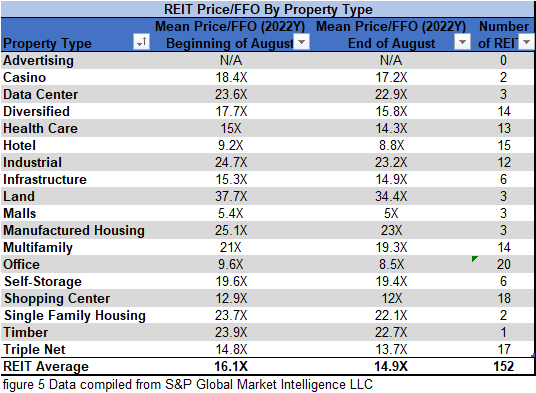
July’s REIT sector rebound sharply reversed in August as REITs averaged a -5.29% total return. REITs underperformed the broader market, suffering deeper declines than the Dow Jones Industrial Average (-3.7%), S&P 500 (-4.1%), and NASDAQ (-4.5%). The market cap-weighted Vanguard Real Estate ETF (VNQ) saw a lower total return than the average REIT in August (-6.01% vs. -5.29%) and remains deeper in the red YTD (-18.88% vs. -16.26%). The spread between the 2022 FFO multiples of large cap REITs (20.0x) and small cap REITs (13.4x) widened in August as multiples decreased by 0.7 turns for large caps and 1.1 turns for small caps. In this monthly publication, I will provide REIT data on numerous metrics to help readers identify which property types and individual securities currently offer the best opportunities to achieve their investment goals.


2 out of 18 Property Types Yielded Positive Total Returns in August
11 percent of REIT property types averaged a positive total return in August, with a 15.55% total return spread between the best and worst performing property types. Office (-12.33%) and Diversified (-9.24%) REITs had the worst average total returns in August. Office fundamentals continue to be an area of concern due to the uncertainty regarding when and to what extent work-from-home employees will eventually return to the office. Office as an asset class can also struggle during recessions, so back to back quarters with negative US GDP have further shaken confidence that investors will be able to achieve strong returns through Office REITs.
Shopping Center (+3.21%) and Self Storage (+0.78%) were the only REIT property types to finish in the black at the end of a rough August for the market. Self Storage REITs have historically remained more resilient throughout economic downturns and faced less selling pressure in August than their more economically sensitive peers.


Performance of Individual Securities
Cedar Realty Trust (CDR) merged with Wheeler REIT (WHLR) on August 22nd. The combined entity will continue to trade under the name Wheeler REIT (WHLR) and CDR has ceased trading. The preferred shares of both REITs will continue to trade on their respective exchanges. Holders of CDR common shares and OP units received $9.48/share from the merger. In addition, a $19.52/share special dividend was paid to all shareholders of record as of August 19th.
Retail Value Inc. (OTCPK:RVIC) (+201%) tripled after releasing a Q2 2022 earnings report that revealed updated financials. RVIC had filed a certificate of dissolution on June 30th, so investors have been watching closely to see how much will be left to distribute to shareholders. RVIC will continue to exist for the purpose of “paying, satisfying and discharging any unknown or contingent claims or any debts or other obligations, collecting and distributing its assets, and doing all other acts required to liquidate and wind up its business and affairs.” Each quarterly earnings report will provide updated financials that could cause similarly large share price movement to what was seen in August given the visibility into the magnitude of potential payout at or before liquidation.
Franklin Street Properties (FSP) (-25.86%) continues to struggle to an even greater degree than most of their office REIT peers, posting a dismal -8.5% SS-NOI growth in Q2 2022. This poor operating performance followed the July announcement that FSP switched to a variable dividend that slashed the payout from $0.09 in April to only $0.01 in July. FSP underperformed all other REITs in August.
15.06% of REITs had a positive return in August, with 18.86% in the black year to date. During the first eight months of last year, the average REIT had a +28.59% return, whereas this year the average REIT has seen a -16.26% total return.

Dividend Yield
Dividend yield is an important component of a REIT’s total return. The particularly high dividend yields of the REIT sector are, for many investors, the primary reason for investment in this sector. As many REITs are currently trading at share prices well below their NAV, yields are currently quite high for many REITs within the sector. Although a particularly high yield for a REIT may sometimes reflect a disproportionately high risk, there exist opportunities in some cases to capitalize on dividend yields that are sufficiently attractive to justify the underlying risks of the investment. I have included below a table ranking equity REITs from highest dividend yield (as of 08/31/2022) to lowest dividend yield.


REIT Premium/Discount to NAV by Property Type
Below is a downloadable data table, which ranks REITs within each property type from the largest discount to the largest premium to NAV. The consensus NAV used for this table is the average of analyst NAV estimates for each REIT. Both the NAV and the share price will change over time, so I will continue to include this table in upcoming issues of The State of REITs with updated consensus NAV estimates for each REIT for which such an estimate is available.

Takeaway
The large cap REIT premium (relative to small cap REITs) widened in August and investors are now paying on average about 49% more for each dollar of 2022 FFO/share to buy large cap REITs than small cap REITs (20x/13.4x – 1 = 49.3%). As can be seen in the table below, there is presently a strong positive correlation between market cap and FFO multiple.

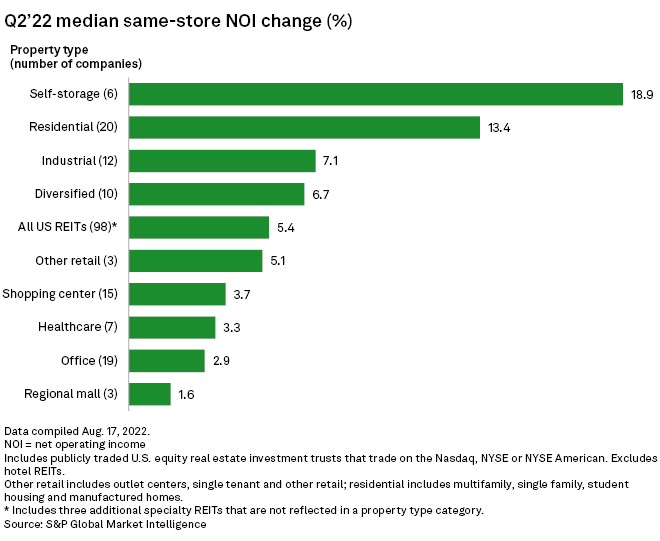
As can be seen in the graph below, these SS-NOI growth gains have not just come from rent increases, but also from improving occupancy.
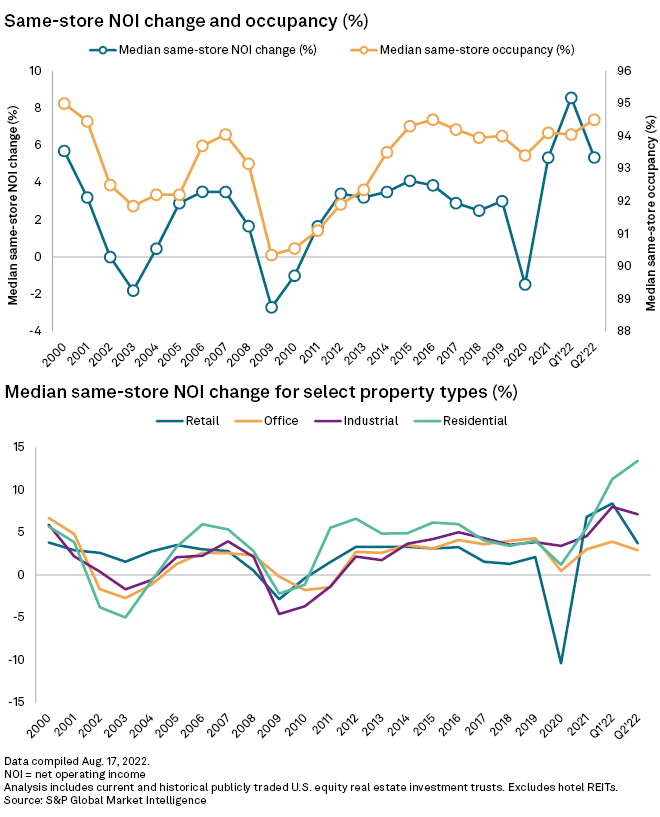
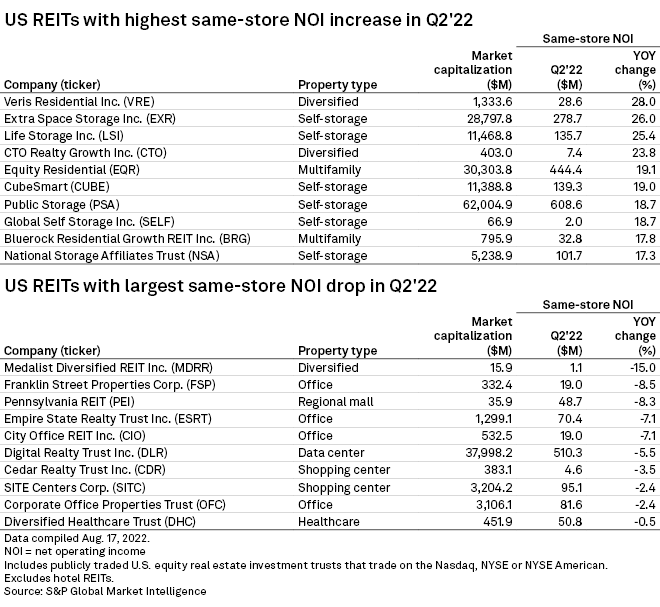
Same-store NOI growth varied by property type and between individual REITs within each property type in Q2 2022. All 6 Self Storage REITs achieved SS-NOI growth greater than 17%, whereas performance was not as favorable for Office REITs such as Franklin Street Properties (FSP) at -8.5%, Empire State Realty Trust (ESRT) at -7.1%, City Office REIT (CIO) at -7.1% and Corporate Office Properties Trust (OFC) at -2.4% SS-NOI growth. Within some property types, however, there has been significant disparity of SS-NOI growth such as in Malls: Pennsylvania REIT (PEI) endured the 3rd worst SS-NOI decline of all non-hotel REITs at -8.3%, whereas Mall REIT peers CBL Properties (CBL) (+1.6%) and Macerich (MAC) (+7.8%) achieved positive growth. This illustrates the importance of both property type allocation and individual stock selection in achieving positive alpha.
Important Notes and Disclosure
All articles are published and provided as an information source for investors capable of making their own investment decisions. None of the information offered should be construed to be advice or a recommendation that any particular security, portfolio of securities, transaction, or investment strategy is suitable for any specific person. The information offered is impersonal and not tailored to the investment needs of any specific person.
We cannot determine whether the content of any article or recommendation is appropriate for any specific person. Readers should contact their financial professional to discuss the suitability of any of the strategies or holdings before implementation in their portfolio. Research and information are provided for informational purposes only and are not intended for trading purposes. NEVER make an investment decision based solely on the information provided in our articles.
We may hold, purchase, or sell positions in securities mentioned in our articles and will not disclose this information to subscribers, nor the time the positions in the securities were acquired. We may liquidate shares in profiled companies at any time without notice. We may also take positions inconsistent with the information and views expressed on our website.
We routinely own and trade the same securities purchased or sold for advisory clients of 2MCAC. This circumstance is communicated to our clients on an ongoing basis. As fiduciaries, we prioritize our clients’ interests above those of our corporate and personal accounts to avoid conflict and adverse selection in trading these commonly held interests.
Past performance does not guarantee future results. Investing in publicly held securities is speculative and involves risk, including the possible loss of principal. Historical returns should not be used as the primary basis for investment decisions. Although the statements of fact and data in this report have been obtained from sources believed to be reliable, 2MCAC does not guarantee their accuracy and assumes no liability or responsibility for any omissions/errors
Commentary may contain forward-looking statements that are by definition uncertain. Actual results may differ materially from our forecasts or estimations, and 2MCAC and its affiliates cannot be held liable for the use of and reliance upon the opinions, estimates, forecasts, and findings in this article.
Through October 2021, The State of REITs was published exclusively on Seeking Alpha by Simon Bowler, Sector Analyst at 2nd Market Capital Services Corporation (2MCSC). Editions subsequent to October 2021 will be published on this website in addition to other platforms that may include Seeking Alpha. 2MCSC was formed in 1989 and provides investment research and consulting services to the financial services industry and the financial media. 2MCSC does not provide investment advice. 2MCSC is a separate entity but related under common ownership to 2nd Market Capital Advisory (2MCAC), a Wisconsin registered investment advisor. Simon Bowler is an investment advisor representative of 2MCAC. Any positive comments made by others should not be construed as an endorsement of the author's abilities to act as an investment advisor.
S&P disclosure: S&P Global Market Intelligence LLC. Contains copyrighted material distributed under license from S&P.