
The State of REITs: July 2023 Edition
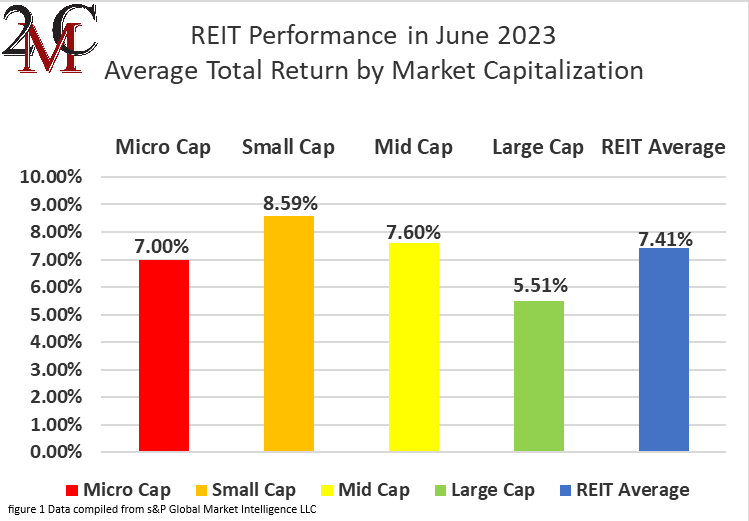
- After 4 straight months in the red, the REIT sector surged back into the black year to date with a stellar +7.41% total return in June.
- Small cap REITs (+8.59%) outperformed again in June. Large caps (+5.51%) again underperformed their smaller REIT peers in June.
- A remarkable 87.34% of REIT securities had a positive total return in June with 49.69% in the black year to date.
- Timber (+13.49%), Advertising (+11.99%) and Office (+11.95%) outperformed other REIT property types in June. Land (+1.30%), Self-Storage (+2.32%) and Casino (+2.50%) REITs averaged the smallest gains.
- The average REIT NAV discount narrowed from -26.57% to -22.44% during June. The median NAV discount narrowed from -24.41% to -20.48%.
REIT Performance
The REIT sector ended a four month slide with a strong total return rebound in June. REITs (+7.41%) solidly outperformed the S&P 500 (+5.98%), NASDAQ (+5.92%) and Dow Jones Industrial Average (+4.35%). The market cap weighted Vanguard Real Estate ETF (VNQ) underperformed the average REIT in June (+5.62% vs. +7.41%), but has outperformed YTD (+3.44% vs. +0.46%). The spread between the 2023 FFO multiples of large cap REITs (17.2x) and small cap REITs (11.7x) remained flat in June as multiples expanded 0.5 turns for large caps and 0.5 turns for small caps. Investors currently need to pay an average of 47.0% more for each dollar of FFO from large cap REITs relative to small cap REITs. In this monthly publication, I will provide REIT data on numerous metrics to help readers identify which property types and individual securities currently offer the best opportunities to achieve their investment goals.

18 out of 18 Property Types Yielded Positive Total Returns in June
100% percent of REIT property types averaged a positive total return in June, with a 12.19% total return spread between the best and worst performing property types. Timber (+13.49%) and Advertising (+11.99%) were the best performing property types in June. Timber REITs soared in June fueled by a resurgence in new housing starts in May. Weyerhaeuser (WY) (+17.70%) and PotlatchDeltic (PCH) (+14.70%) had the biggest gains.


Performance of Individual Securities
Indus Realty Trust (INDT) was acquired on June 29th by Centerbridge Partners and GIC Real Estate for $67/share. This was an all-cash transaction with a total purchase price of approximately $868M. Post-acquisition INDT is no longer publicly traded.
Industrial Logistics Properties Trust (ILPT) was one of the worst performing REITs during the February through May REIT selloff, suffering a brutal -58.74% total return during that stretch. However, ILPT fully reversed the declines from earlier in the year with a sharp rebound in June (+82.32%). This massive recovery brought ILPT to a +1.70% YTD return that is now slightly outpacing the average REIT (+0.46%).
Power REIT (PW) (-15.46%) continued to freefall in June, extending the slide that has driven the share price down -88.21% in the past 12 months. With no major news released for the REIT in June, there were no updates to suggest that PW’s tenant issues are being successfully resolved.
87.34% of REITs had a positive total return in June with 49.69% in the black year to date. During the first six months of last year the average REIT had a brutal -17.98% return. During the first six months of this year the average REIT has performed much better with a +0.46% total return.

Dividend Yield
Dividend yield is an important component of a REIT’s total return. The particularly high dividend yields of the REIT sector are, for many investors, the primary reason for investment in this sector. As many REITs are currently trading at share prices well below their NAV, yields are currently quite high for many REITs within the sector. Although a particularly high yield for a REIT may sometimes reflect a disproportionately high risk, there exist opportunities in some cases to capitalize on dividend yields that are sufficiently attractive to justify the underlying risks of the investment. I have included below a table ranking equity REITs from highest dividend yield (as of 06/30/2023) to lowest dividend yield.

Although a REIT’s decision regarding whether to pay a quarterly dividend or a monthly dividend does not reflect on the quality of the company’s fundamentals or operations, a monthly dividend allows for a smoother cash flow to the investor. Below is a list of equity REITs that pay monthly dividends ranked from highest yield to lowest yield.

REIT Premium/Discount to NAV by Property Type
Below is a downloadable data table, which ranks REITs within each property type from the largest discount to the largest premium to NAV. The consensus NAV used for this table is the average of analyst NAV estimates for each REIT. Both the NAV and the share price will change over time, so I will continue to include this table in upcoming issues of The State of REITs with updated consensus NAV estimates for each REIT for which such an estimate is available.

Takeaway
The large cap REIT premium (relative to small cap REITs) narrowed in June and investors are now paying on average about 47% more for each dollar of 2023 FFO/share to buy large cap REITs than small cap REITs (17.2x/11.7x – 1 = 47.0%). As can be seen in the table below, there is presently a strong positive correlation between market cap and FFO multiple.

The table below shows the average premium/discount of REITs of each market cap bucket. This data, much like the data for price/FFO, shows a strong, positive correlation between market cap and Price/NAV. The average large cap REIT (-8.89%) trades at a high single digit discount to NAV, while mid cap REITs (-16.78%) trade at double digit discount. Small cap REITs (-30.42%) trade at a little over 2/3 of NAV. Micro caps on average continue to trade at less than half of their respective NAVs (-51.45%).

The number of bankruptcy filings in June held steady month over month and remains at an elevated level. In the first half of 2023 there have been more filings than in the first six months of any year since 2010 and almost twice as many as there were over the same period last year. With further rate hikes expected from the Fed in the 2nd half of the year, the pace of bankruptcies is not likely to taper off yet.

The REIT sector saw robust M&A activity from Q2 2021 through Q3 2022, but that activity completely dried up in Q4 2022 and was very muted Q1 2023 as the Fed was moving full speed ahead with interest rate hikes. However, M&A rebounded in Q2 2023 with 4 REIT mergers valued at a combined $24.27B in transaction value.

The largest of H1 2023’s M&A deals was the acquisition of Life Storage by Extra Space Storage (EXR) for $16.04B in April. This was followed by the acquisition of Urstadt Biddle Properties (UBP) by Regency Centers (REG) and 2 mergers involving 4 RMR Group (RMR) managed REITs. Global Net Lease (GNL) acquired Necessity Retail REIT (RTL) and Office Properties Income Trust (OPI) acquired Diversified Healthcare Trust (DHC).

The acquisition target typically sees strong upward price movement upon the announcement of a definitive agreement. It is even common to see prices move upward if a REIT announces that they are merely exploring the possibility of being acquired. However, Diversified Healthcare Trust has seen a disproportionately large surge with a 256.09% total return YTD fueled by the upcoming acquisition.

Correctly identifying potential M&A acquisition targets can certainly be a great source of alpha, but so can identifying REITs with strong fundamentals and dependable dividend growth. While dividend increases are virtually always welcome news to investors, they should certainly not all be viewed the same way given that not all hikes are the same. For example, Presidio Property Trust (SQFT), Host Hotels & Resorts (HST), and Alexandria Real Estate Equities (ARE) all hiked their dividends in June, but the stories behind the hikes are different for all three. SQFT raised the quarterly dividend from $0.022/share in Q1 2023 to $0.023/share in Q2 2023, but this remains a tiny fraction of the $0.106/share dividend SQFT paid a year earlier in Q2 2022. HST’s dividend was suspended from Q2 2020 through Q4 2021 and has been quickly ramping up since being reinstated in Q1 2022, but the quarterly dividend that was raised to $0.15/share in Q2 2023 has not yet fully recovered to the $0.20/share dividend paid pre-Covid. ARE’s dividend hike in June, however, tells a different and much more positive story. ARE’s Q2 2023 dividend of $1.24/share is the largest quarterly dividend the REIT has ever paid and is fueled by strong fundamentals including a remarkable rental rate increase of 48.3% in Q1 2023. While dividend hikes always look attractive on the surface, it is worth digging deeper to identify which REITs are truly achieving sustainable dividend growth and which are merely issuing token raises that don’t reflect strong company fundamentals.
Important Notes and Disclosure
All articles are published and provided as an information source for investors capable of making their own investment decisions. None of the information offered should be construed to be advice or a recommendation that any particular security, portfolio of securities, transaction, or investment strategy is suitable for any specific person. The information offered is impersonal and not tailored to the investment needs of any specific person.
We cannot determine whether the content of any article or recommendation is appropriate for any specific person. Readers should contact their financial professional to discuss the suitability of any of the strategies or holdings before implementation in their portfolio. Research and information are provided for informational purposes only and are not intended for trading purposes. NEVER make an investment decision based solely on the information provided in our articles.
We may hold, purchase, or sell positions in securities mentioned in our articles and will not disclose this information to subscribers, nor the time the positions in the securities were acquired. We may liquidate shares in profiled companies at any time without notice. We may also take positions inconsistent with the information and views expressed on our website.
We routinely own and trade the same securities purchased or sold for advisory clients of 2MCAC. This circumstance is communicated to our clients on an ongoing basis. As fiduciaries, we prioritize our clients’ interests above those of our corporate and personal accounts to avoid conflict and adverse selection in trading these commonly held interests.
Past performance does not guarantee future results. Investing in publicly held securities is speculative and involves risk, including the possible loss of principal. Historical returns should not be used as the primary basis for investment decisions. Although the statements of fact and data in this report have been obtained from sources believed to be reliable, 2MCAC does not guarantee their accuracy and assumes no liability or responsibility for any omissions/errors
Commentary may contain forward-looking statements that are by definition uncertain. Actual results may differ materially from our forecasts or estimations, and 2MCAC and its affiliates cannot be held liable for the use of and reliance upon the opinions, estimates, forecasts, and findings in this article.
Through October 2021, The State of REITs was published exclusively on Seeking Alpha by Simon Bowler, Sector Analyst at 2nd Market Capital Services Corporation (2MCSC). Editions subsequent to October 2021 will be published on this website in addition to other platforms that may include Seeking Alpha. 2MCSC was formed in 1989 and provides investment research and consulting services to the financial services industry and the financial media. 2MCSC does not provide investment advice. 2MCSC is a separate entity but related under common ownership to 2nd Market Capital Advisory (2MCAC), a Wisconsin registered investment advisor. Simon Bowler is an investment advisor representative of 2MCAC. Any positive comments made by others should not be construed as an endorsement of the author's abilities to act as an investment advisor.
S&P disclosure: S&P Global Market Intelligence LLC. Contains copyrighted material distributed under license from S&P.