
The State of REITs: September 2023 Edition
- The REIT sector gave up some of the gains achieved in June and July with a -4.13% average total return in August.
- Small cap REITs (-2.49%) outperformed again in August. Micro caps (-13.08%) badly underperformed their larger REIT peers.
- Only 18.06% of REIT securities had a positive total return in August with 48.13% in the black year to date.
- Data Center (+2.03%) and Industrial (+0.93%) were the only REIT property types in the black in August. Advertising (-16.11%) and Infrastructure (-13.31%) REITs averaged the largest declines.
- The average REIT NAV discount widened from -19.78% to -22.67% during August. The median NAV discount widened from -17.37% to -20.25%.
REIT Performance
After back-to-back strong gains in June and July, REITs lost most of their YTD gains in August with a -4.13% average total return. REITs suffered bigger average losses than the S&P 500 (-1.6%), Dow Jones Industrial Average (-2.0%) and NASDAQ (-2.1%). The market cap weighted Vanguard Real Estate ETF (VNQ) outperformed the average REIT in August (-3.38% vs. -4.13%) and has outperformed YTD as well (+1.98% vs. +0.56%). The spread between the 2023 FFO multiples of large cap REITs (16.8x) and small cap REITs (12.6x) widened in August as multiples compressed 0.4 turns for large caps and 0.9 turns for small caps. Investors currently need to pay an average of 33.3% more for each dollar of FFO from large cap REITs relative to small cap REITs. In this monthly publication, I will provide REIT data on numerous metrics to help readers identify which property types and individual securities currently offer the best opportunities to achieve their investment goals.


Micro cap REITs (-13.08%) severely underperformed their larger peers in August. Small caps (-2.49%) led the REIT sector yet again in August with smaller average declines than mid caps (-3.09%) and large caps (-3.52%). Large cap REITs (+3.23%) are outperforming small caps (+2.63%) by 60 basis points on YTD 2023 total return.
2 out of 18 Property Types Yielded Positive Total Returns in August
Only 11.11% percent of REIT property types averaged a positive total return in August, with an 18.14% total return spread between the best and worst performing property types. Data Center (+2.03%) and Industrial (+0.93%) were the only REIT property types with a positive average total return in August. Digital Realty Trust (DLR) (+5.70%) and Iron Mountain (+3.49%) led Data Centers with strong price gains in the 2nd half of the month.
Advertising (-16.11%) Infrastructure (-13.31%) and Malls (-10.28%) averaged double-digit negative total returns in August. Advertising was dragged down by a sharp share price decline from OUTFRONT Media (OUT) (-24.64%), which has been negatively impacted by uncertainty surrounding the future of the New York MTA agreement that has turned out to be significantly less lucrative than expected.

After another rough month in August, Infrastructure remains the worst performing REIT property type year to date (-30.73%). Land (-15.73%), Advertising (-13.91%) and Malls (-13.58%) have also averaged double-digit negative total returns in 2023. The number of REIT property types in the black year to date decreased from 12 to 8 in August. Data Centers (+28.60%) and Health Care (+23.65%) are the best performing property types year to date.


The REIT sector as a whole saw the average P/FFO (2023Y) decrease 0.3 turns in August from 13.7x down to 13.4x. The average FFO multiple expanded for 17.6% of property types, held steady for 5.9%, and contracted for 76.5%. There are no recent 2023 FFO/share estimates for any of the Timber REITs. Land (35.7x), Data Centers (25.6x), Single Family Housing (20.5x), and Industrial (20.0x) currently trade at the highest average multiples among REIT property types. Malls (4.9x), Office (8.0x), and Hotels (8.0x) all saw multiple contraction in August and remain the only REIT property types trading at single-digit multiples.
Performance of Individual Securities
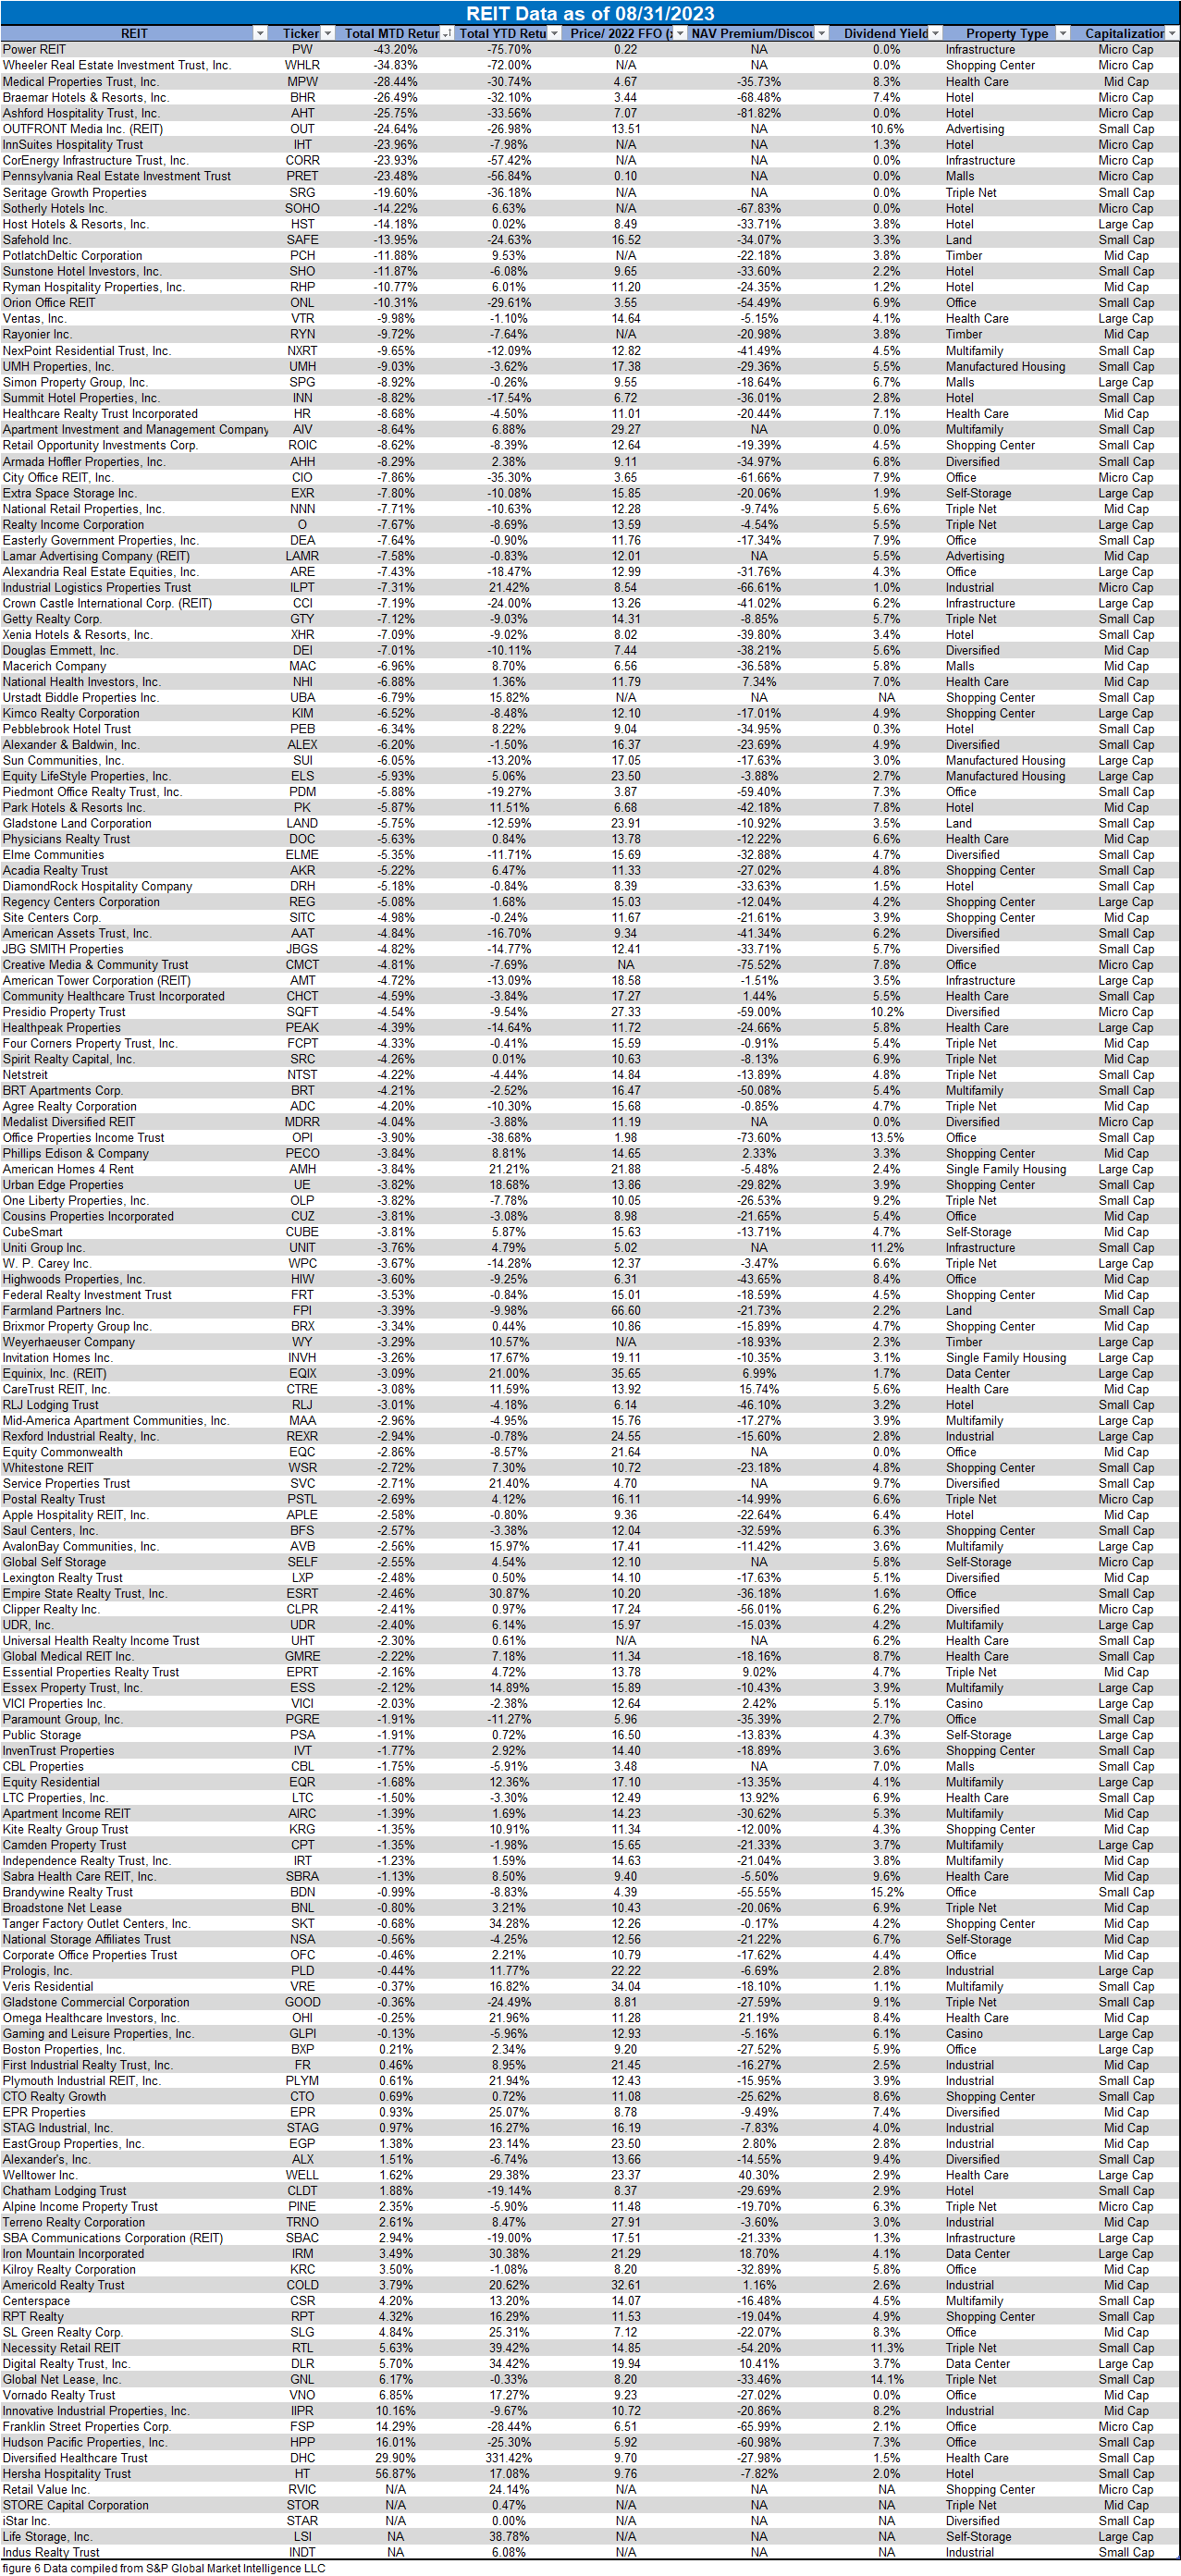
Urstadt Biddle Properties (UBA) was acquired by Regency Centers (REG) on August 18th in a stock-for-stock transaction. Shareholders of Urstadt Biddle received 0.347 shares of REG for each share of UBA or UBP.
Hersha Hospitality Trust (HT) (+56.87%) soared on the announcement that the hotel REIT will be acquired by KSL Capital Partners. If the sale is approved by a majority of Hersha shareholders, HT common stock shareholders will receive $10/share at the closing of the transaction. This was a significant premium to the $6.28/share closing share price prior to the announcement.
Power REIT (PW) (-43.20%) continues to freefall due to persistent tenant quality concerns. After yet another brutal month, PW surpassed Wheeler REIT (WHLR) (-34.83%) as the worst performing REIT of 2023 with a dismal -75.70% total return.
Only 18.06% of REITs had a positive total return in August with 48.13% in the black year to date. During the first eight months of last year, the average REIT had a brutal -16.26% return. During the first eight months of this year, the average REIT has performed better with a +0.56% total return.
.
Dividend Yield
Dividend yield is an important component of a REIT’s total return. The particularly high dividend yields of the REIT sector are, for many investors, the primary reason for investment in this sector. As many REITs are currently trading at share prices well below their NAV, yields are currently quite high for many REITs within the sector. Although a particularly high yield for a REIT may sometimes reflect a disproportionately high risk, there exist opportunities in some cases to capitalize on dividend yields that are sufficiently attractive to justify the underlying risks of the investment. I have included below a table ranking equity REITs from highest dividend yield (as of 08/31/2023) to lowest dividend yield.

Although a REIT’s decision regarding whether to pay a quarterly dividend or a monthly dividend does not reflect on the quality of the company’s fundamentals or operations, a monthly dividend allows for a smoother cash flow to the investor. Below is a list of equity REITs that pay monthly dividends ranked from highest yield to lowest yield.

REIT Premium/Discount to NAV by Property Type
Below is a downloadable data table, which ranks REITs within each property type from the largest discount to the largest premium to NAV. The consensus NAV used for this table is the average of analyst NAV estimates for each REIT. Both the NAV and the share price will change over time, so I will continue to include this table in upcoming issues of The State of REITs with updated consensus NAV estimates for each REIT for which such an estimate is available.

Takeaway
The large cap REIT premium (relative to small cap REITs) widened in August and investors are now paying on average about 33% more for each dollar of 2023 FFO/share to buy large cap REITs than small cap REITs (16.8x/12.6x – 1 = 33.3%). As can be seen in the table below, there is presently a strong positive correlation between market cap and FFO multiple.

The table below shows the average NAV premium/discount of REITs of each market cap bucket. This data, much like the data for price/FFO, shows a strong, positive correlation between market cap and Price/NAV. The average large cap REIT (-10.88%) and mid cap REIT (-14.92%) trade at a low double-digit discount to NAV, while small cap REITs (-29.89%) trade at a little less than 3/4 of NAV. Micro caps on average continue to trade at less than half of their respective NAVs (-57.79%).

Bankruptcy filings in August declined month over month but remained elevated for the 9th straight month. The number of bankruptcies in just the first 8 months of 2023 has already surpassed the total bankruptcies for all of 2021 or 2022 but remains slightly behind the pace of bankruptcies in 2020. With inflation beginning to accelerate again, further rate hikes in Q4 2023 are still very much on the table. This also likely pushes back the time frame for the Fed to begin a rate cutting cycle that would bring much needed relief to businesses that are struggling with an elevated cost of capital.

Although the cost of new capital has risen sharply for REITs, this is offset to varying degrees by the resiliance of REIT fundamentals. The REIT sector as a whole saw a healthy 4% increase in same-store NOI (SS-NOI), but with significant variance across property types.

Malls (-0.2%) were the only property type to see SS-NOI decline year over year in Q2 2023. Even Office REITs achieved a +2% gain despite a challenging leasing environment. SS-NOI growth was strongest, however, for Industrial REITs (+8.2%), led by Terreno Realty (TRNO) (+14.5%), Americold Realty Trust (COLD) (+12.7%), First Industrial Realty Trust (FR) (+11.0%) and Rexford Industrial Realty (REXR) (+8.0%).

This continued fundamental growth in the REIT sector facilitates (and at times necessitates due to REIT structure rules) REITs to continue to raise their dividends. This growing income stream in a portfolio can be a significant contributor to total return. Of course, not all REITs are achieving this growth and some have actually needed to cut or suspend their dividends, so it is essential that investors do their due diligence on the company level to successfully capitalize on the continued strength of the REIT sector.
Important Notes and Disclosure
All articles are published and provided as an information source for investors capable of making their own investment decisions. None of the information offered should be construed to be advice or a recommendation that any particular security, portfolio of securities, transaction, or investment strategy is suitable for any specific person. The information offered is impersonal and not tailored to the investment needs of any specific person.
We cannot determine whether the content of any article or recommendation is appropriate for any specific person. Readers should contact their financial professional to discuss the suitability of any of the strategies or holdings before implementation in their portfolio. Research and information are provided for informational purposes only and are not intended for trading purposes. NEVER make an investment decision based solely on the information provided in our articles.
We may hold, purchase, or sell positions in securities mentioned in our articles and will not disclose this information to subscribers, nor the time the positions in the securities were acquired. We may liquidate shares in profiled companies at any time without notice. We may also take positions inconsistent with the information and views expressed on our website.
We routinely own and trade the same securities purchased or sold for advisory clients of 2MCAC. This circumstance is communicated to our clients on an ongoing basis. As fiduciaries, we prioritize our clients’ interests above those of our corporate and personal accounts to avoid conflict and adverse selection in trading these commonly held interests.
Past performance does not guarantee future results. Investing in publicly held securities is speculative and involves risk, including the possible loss of principal. Historical returns should not be used as the primary basis for investment decisions. Although the statements of fact and data in this report have been obtained from sources believed to be reliable, 2MCAC does not guarantee their accuracy and assumes no liability or responsibility for any omissions/errors
Commentary may contain forward-looking statements that are by definition uncertain. Actual results may differ materially from our forecasts or estimations, and 2MCAC and its affiliates cannot be held liable for the use of and reliance upon the opinions, estimates, forecasts, and findings in this article.
Through October 2021, The State of REITs was published exclusively on Seeking Alpha by Simon Bowler, Sector Analyst at 2nd Market Capital Services Corporation (2MCSC). Editions subsequent to October 2021 will be published on this website in addition to other platforms that may include Seeking Alpha. 2MCSC was formed in 1989 and provides investment research and consulting services to the financial services industry and the financial media. 2MCSC does not provide investment advice. 2MCSC is a separate entity but related under common ownership to 2nd Market Capital Advisory (2MCAC), a Wisconsin registered investment advisor. Simon Bowler is an investment advisor representative of 2MCAC. Any positive comments made by others should not be construed as an endorsement of the author's abilities to act as an investment advisor.
S&P disclosure: S&P Global Market Intelligence LLC. Contains copyrighted material distributed under license from S&P.